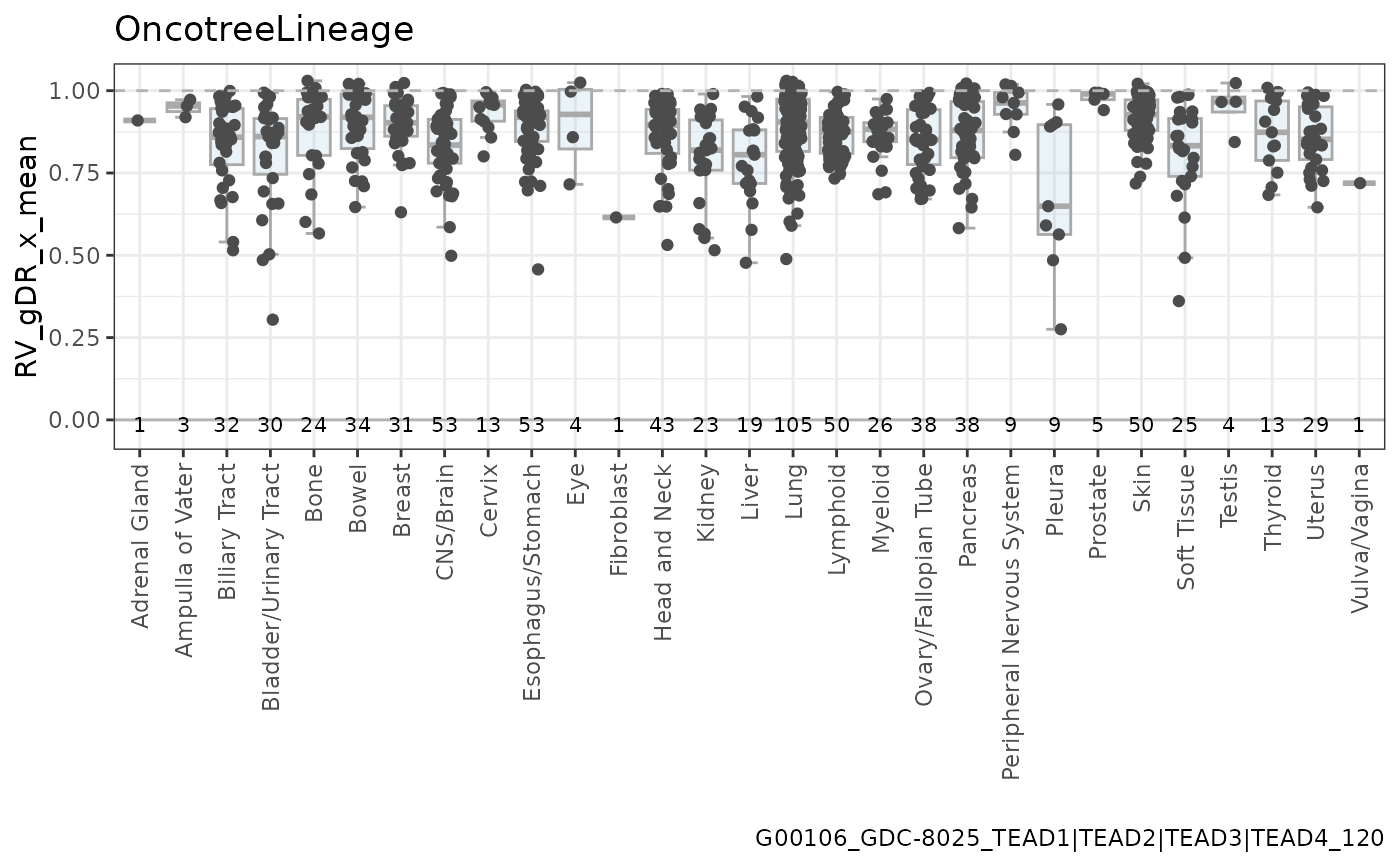
Plot boxplot for metric values grouped by metadata from DepMap
Source:R/plot-prism.R
plot_boxplot_meta.RdPlot boxplot for metric values grouped by metadata from DepMap
Usage
plot_boxplot_meta(
  dt_response,
  dt_depmap,
  selected_feat_meta_col,
  with_1_item_grp = TRUE,
  max_x_lbl_length = 60,
  with_inf = FALSE
)
Arguments
- dt_response
data.tablewith experimental response data (rows are samples) for one metric outputted by one of functions:prep_dt_response_metric_sa,prep_dt_response_dose_sa,prep_dt_response_scoresorprep_dt_response_metric_diff,- dt_depmap
data.tablewith dependent variables data load from DepMap - for one metadata; (rows are samples, columns are metadata levels); outputted byprep_dt_depmap_meta- selected_feat_meta_col
string with the name of the selected metadata from
dt_depmap(will be used as a plot title)- with_1_item_grp
logical flag indicating whether to show group with only one item
- max_x_lbl_length
numeric value for the maximum number of characters in the x-axis label
- with_inf
a logical flag indicating whether infinite values should be shown on boxplots
Author
Janina Smoła janina.smola@external.roche.com
Examples
mae_prism <- gDRutils::get_synthetic_data("prism")
se_prism <- mae_prism[[gDRutils::get_supported_experiments("sa")]]
dt_metrics <- gDRutils::convert_se_assay_to_dt(se_prism, "Metrics")
dt_response <- prep_dt_response_metric_sa(
  dt_metrics = dt_metrics,
  d_name = unique(dt_metrics[["DrugName"]])[1],
  normalization_type = "RV", metric = "x_mean")
meta_data_path <- system.file("depmap_data/Model.csv.gz", package = "gDRtestData")
obj_depmap_meta <- prep_dt_depmap_meta(meta_data_path, metadata_col = "OncotreeLineage")
plot_boxplot_meta(
  dt_response = dt_response,
  dt_depmap = obj_depmap_meta[["dt_depmap"]],
  selected_feat_meta_col = obj_depmap_meta[["selected_feat_meta_col"]])