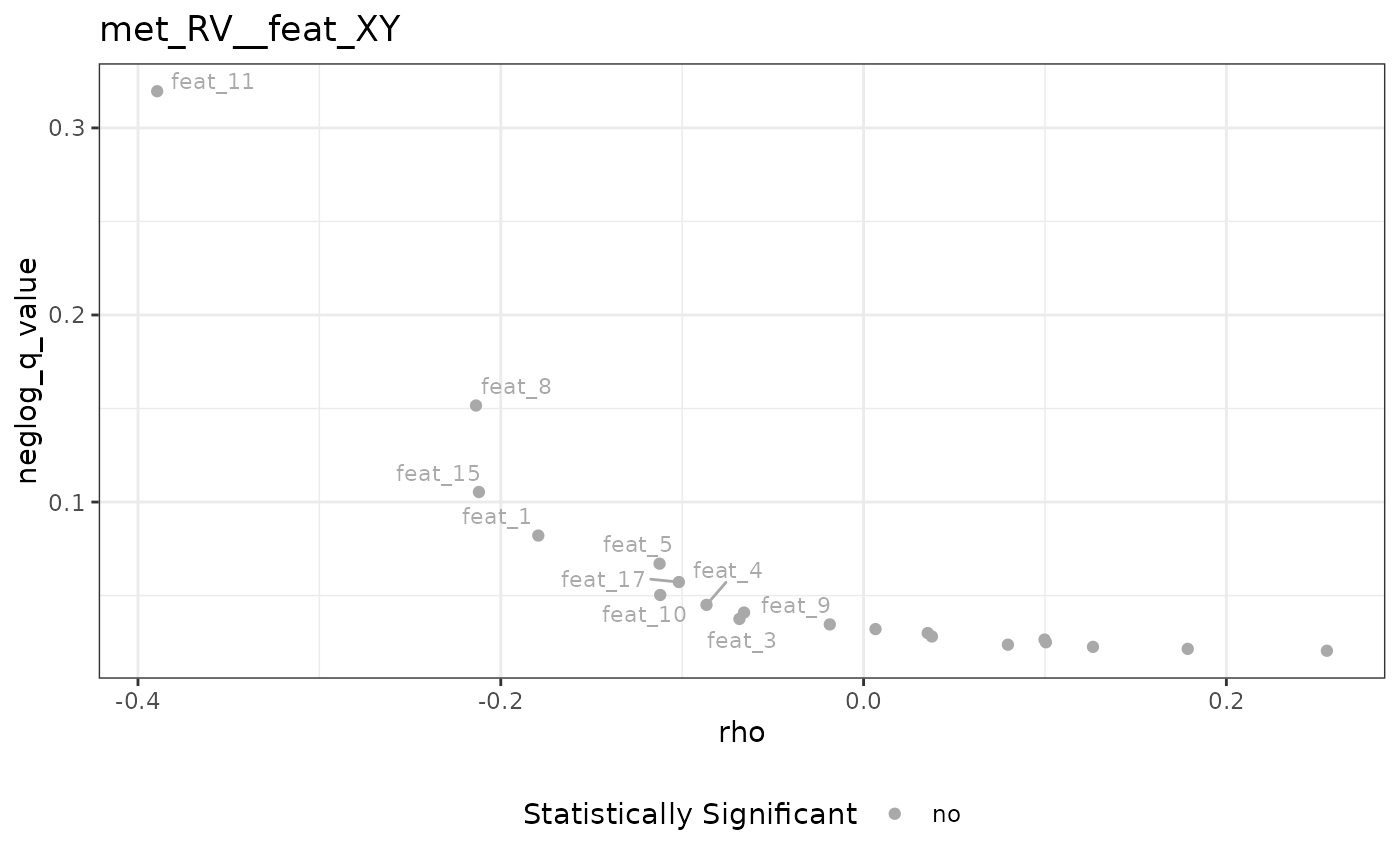
Volcano plot with association
Usage
plot_volcano_assoc(
  dt_assoc,
  selected_feat_meta_col,
  selected_metric,
  condition_info = NULL,
  alpha = 0.05,
  named_p_top = 10,
  max_N = NULL
)
Arguments
- dt_assoc
data.tablewith the calculated linear association between DepMap and metrics outputted bycalc_assoc- selected_feat_meta_col
string describing the name of the associated feature/metadata from DepMap
- selected_metric
string describing the name of the selected metric used the association calculation
- condition_info
string describing experiment condition (preferred:
"DrugName"_"Gnumber"_"drug_moa"_"Duration")- alpha
numeric cutoff to identify statistically significant correlations
- named_p_top
numeric value for p-top statistically significant correlations to be labeled on the plot
- max_N
numeric value for limit the maximum number of non-statistically significant points to plot; for default
NULLall points will be plotted.
Examples
Y <- matrix(seq(0.5, 2, length.out = 50), nrow = 50,
            dimnames = list(sprintf("row_%s", 1:50), "met_1"))
X <- matrix(
  withr::with_seed(42, sample(c(NA, seq(0.35, 23.5, 1.25)),
                              size = 50*20, replace = TRUE)),
  nrow = 50,
  dimnames = list(sprintf("row_%s", 1:50), sprintf("feat_%s", 1:20)))
tab_assoc <- calc_assoc(X, Y)
plot_volcano_assoc(tab_assoc,
                   selected_feat_meta_col = "feat_XY",
                   selected_metric = "met_RV")