Plot a violin plot for normalized or averaged data (single-agent and combo) to control the quality of the data
Source:R/plot-normalization_qc.R
plot_var_distribution_qc.RdPlot a violin plot for normalized or averaged data (single-agent and combo) to control the quality of the data
Arguments
- dt_assay
data.table representing data from the assay, outputted by
gDRutils::convert_se_assay_to_dt(se, <assay_name>)for assay_name likeNormalizedorAveragedandSummarizedExperimentwith chosen data type: single-agent or combo- cl_name
string cell line name to be plotted (Cell Line Name)
- metric
string with variable name to be plotted; it has to be in
dt_assay- normalization_type
string with normalization_types to be selected one of: "GR" ("GRvalue") or "RV" ("RelativeViability")
Examples
mae <- gDRutils::get_synthetic_data("combo_matrix")
se <- mae[[gDRutils::get_supported_experiments("sa")]]
dt_norm <- gDRutils::convert_se_assay_to_dt(se, "Normalized")
cl_name <- dt_norm[["CellLineName"]][1]
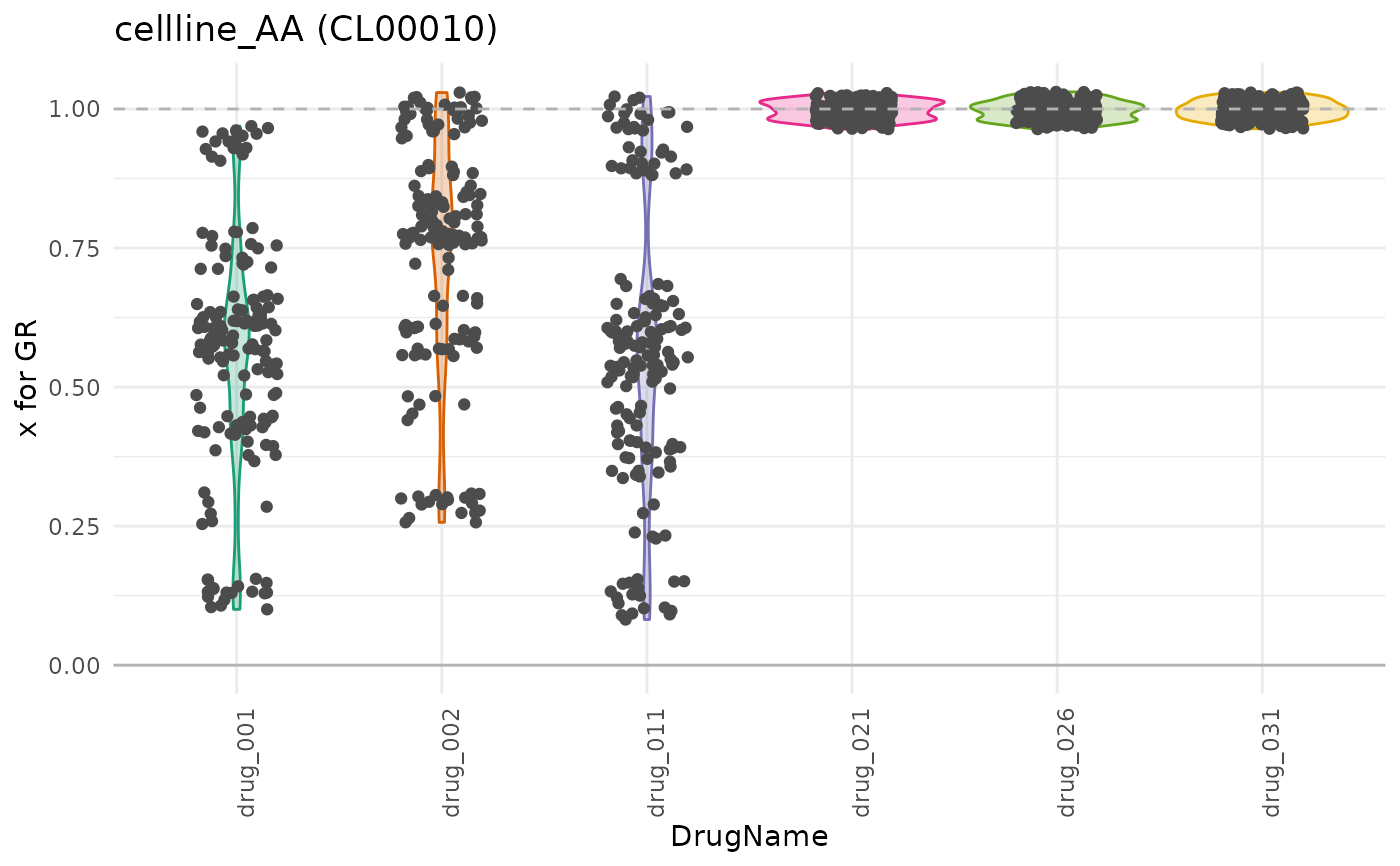
plot_var_distribution_qc(dt_assay = dt_norm,
cl_name = cl_name)
 dt_average <- gDRutils::convert_se_assay_to_dt(se, "Averaged")
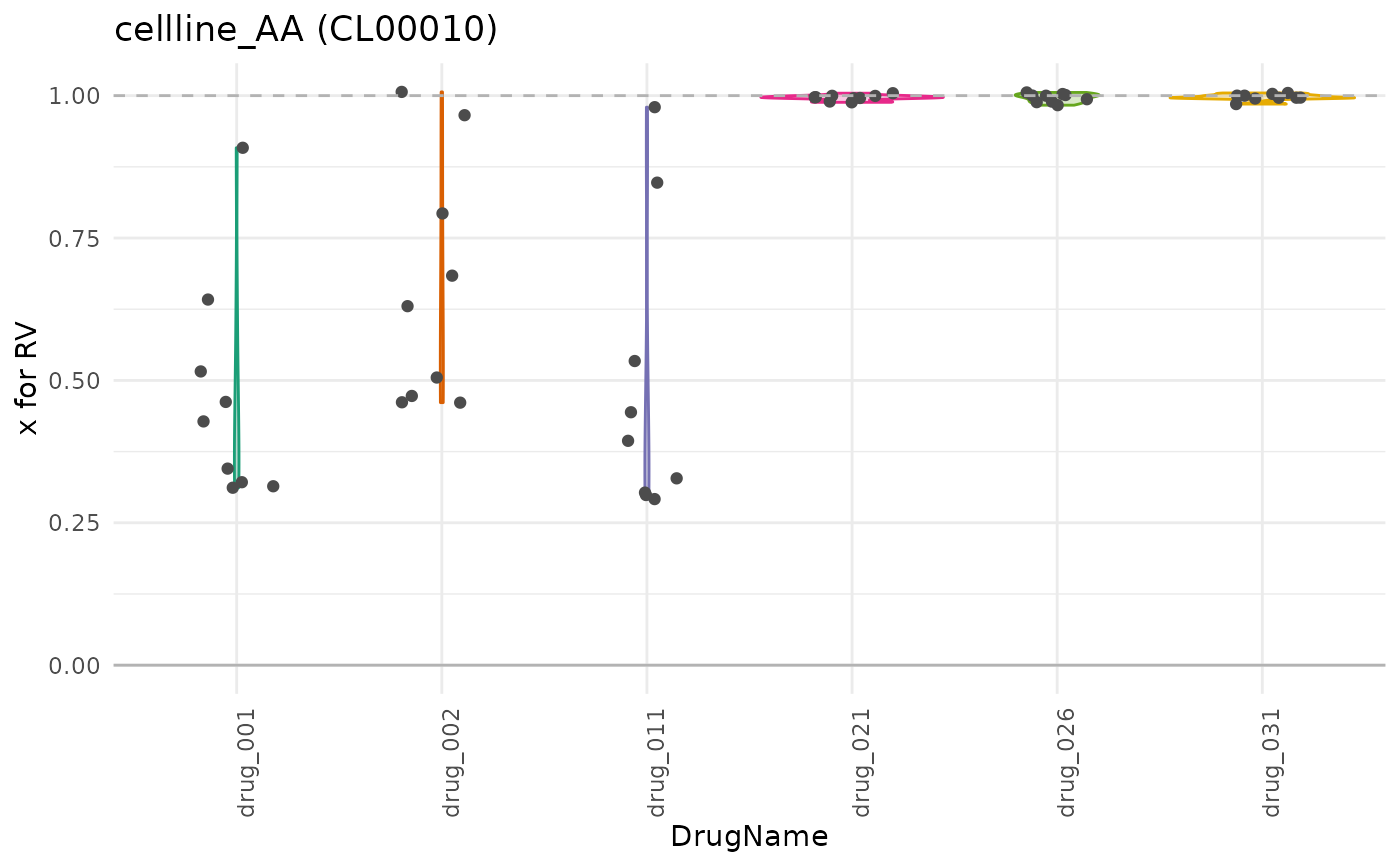
plot_var_distribution_qc(dt_assay = dt_average,
cl_name = cl_name,
normalization_type = "RV")
dt_average <- gDRutils::convert_se_assay_to_dt(se, "Averaged")
plot_var_distribution_qc(dt_assay = dt_average,
cl_name = cl_name,
normalization_type = "RV")
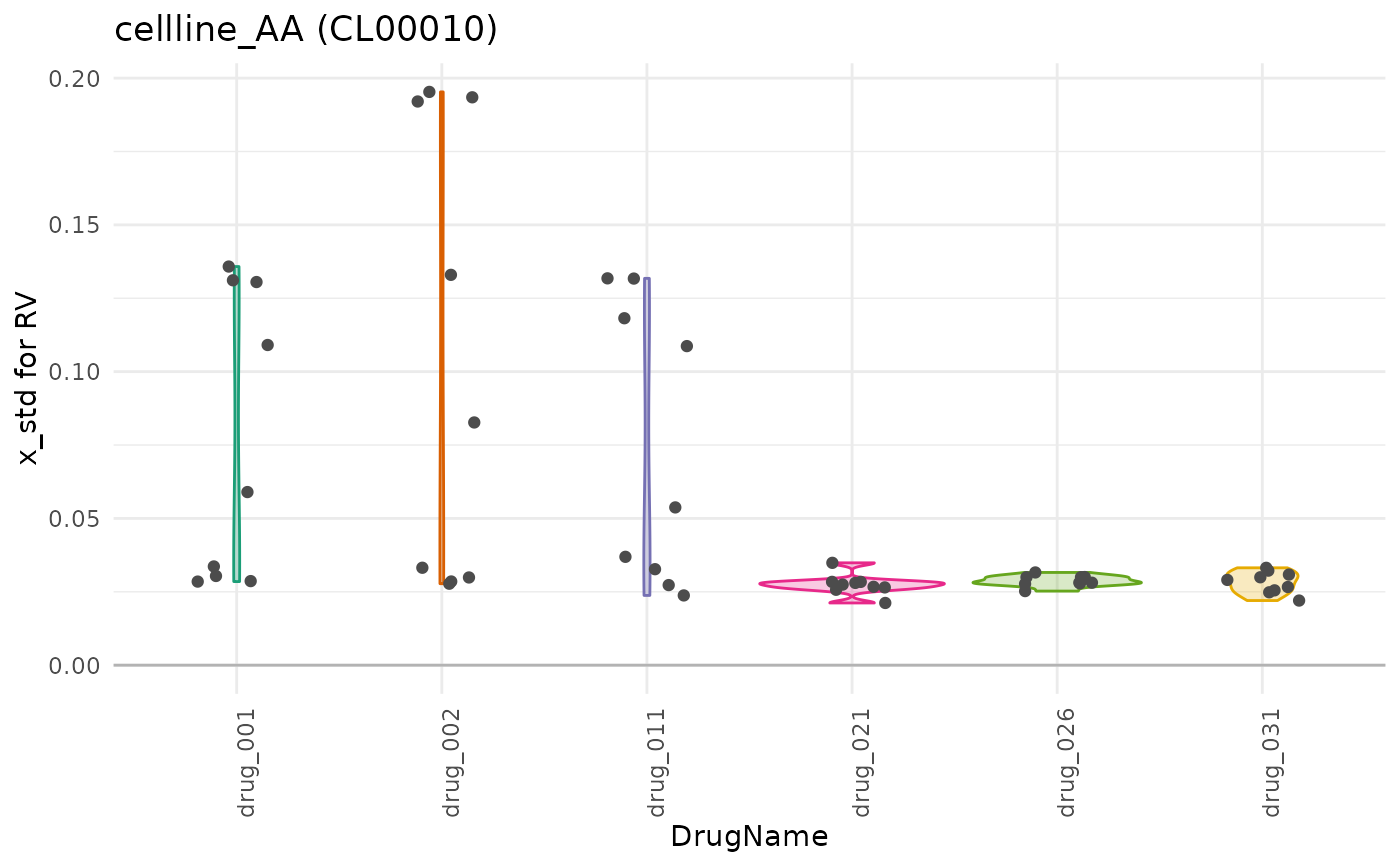
 plot_var_distribution_qc(dt_assay = dt_average,
cl_name = cl_name,
metric = "x_std",
normalization_type = "RV")
plot_var_distribution_qc(dt_assay = dt_average,
cl_name = cl_name,
metric = "x_std",
normalization_type = "RV")
 mae <- gDRutils::get_synthetic_data("combo_matrix")
se <- mae[[gDRutils::get_supported_experiments("combo")]]
dt_norm <- gDRutils::convert_se_assay_to_dt(se, "Normalized")
cl_name <- dt_norm[["CellLineName"]][1]
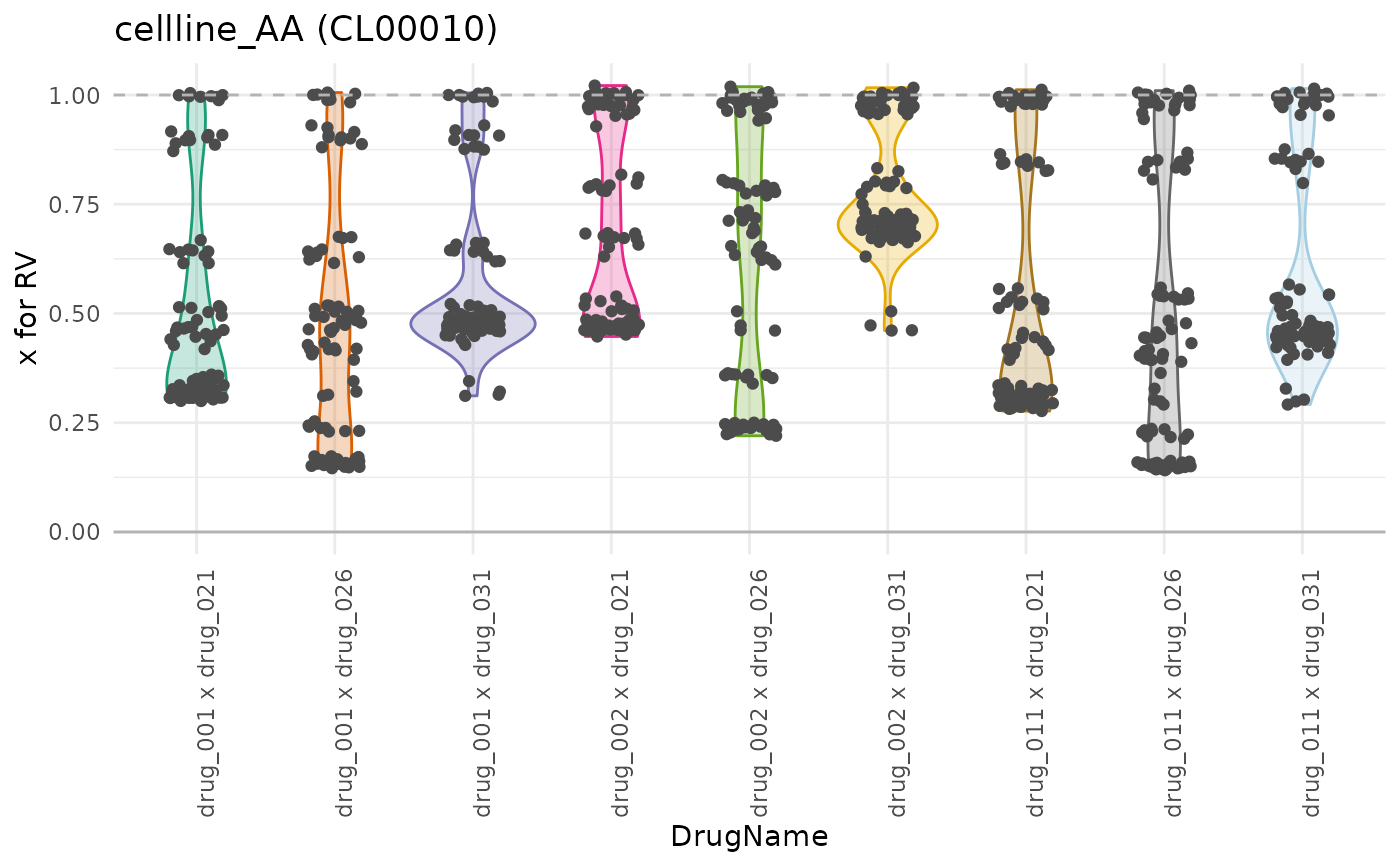
plot_var_distribution_qc(dt_assay = dt_norm,
cl_name = cl_name)
mae <- gDRutils::get_synthetic_data("combo_matrix")
se <- mae[[gDRutils::get_supported_experiments("combo")]]
dt_norm <- gDRutils::convert_se_assay_to_dt(se, "Normalized")
cl_name <- dt_norm[["CellLineName"]][1]
plot_var_distribution_qc(dt_assay = dt_norm,
cl_name = cl_name)
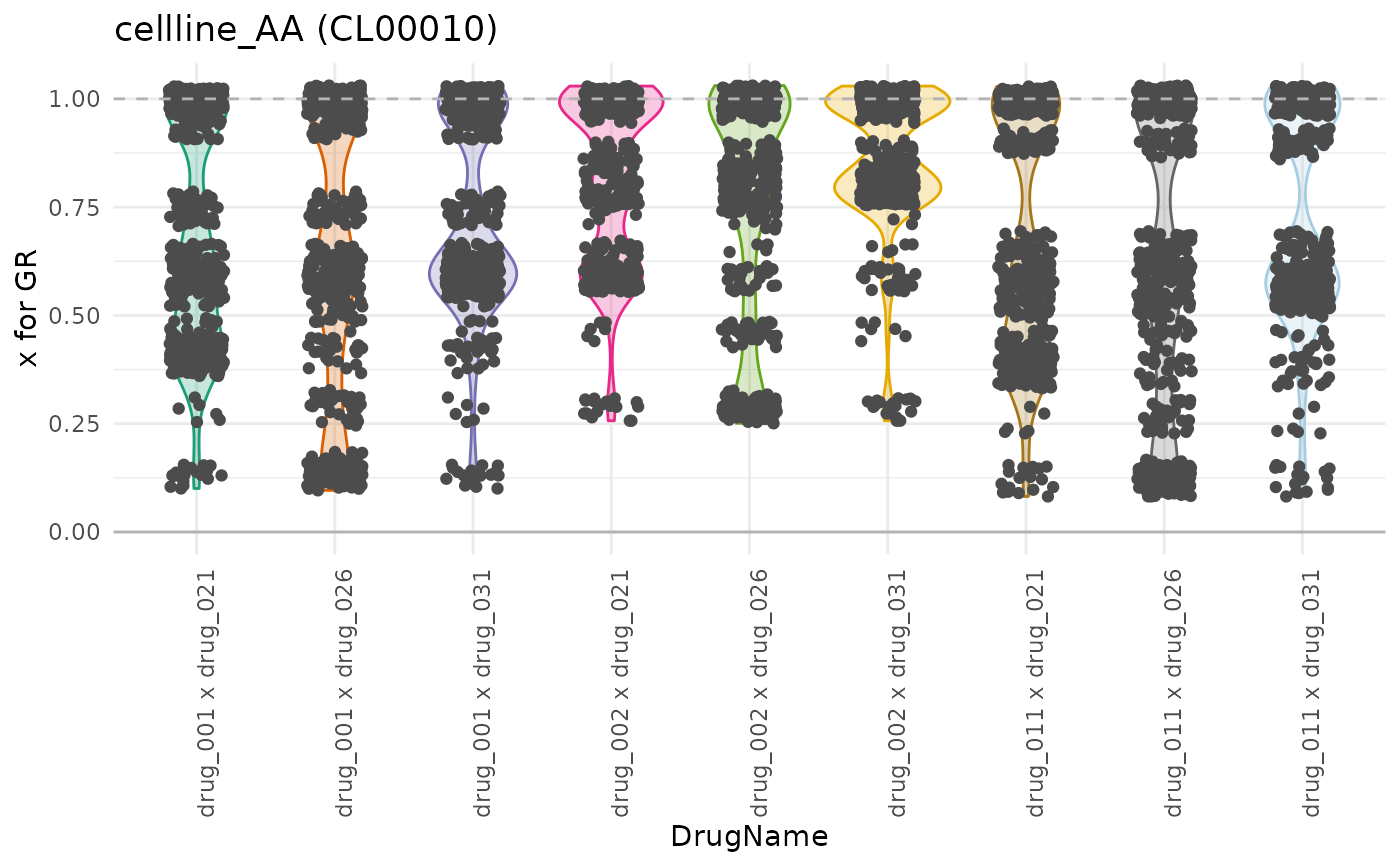 dt_average <- gDRutils::convert_se_assay_to_dt(se, "Averaged")
plot_var_distribution_qc(dt_assay = dt_average,
cl_name = cl_name,
normalization_type = "RV")
dt_average <- gDRutils::convert_se_assay_to_dt(se, "Averaged")
plot_var_distribution_qc(dt_assay = dt_average,
cl_name = cl_name,
normalization_type = "RV")