Plot data from a specific column
Author
Bartosz Czech czech.bartosz@external.gene.com
Examples
test_data <- data.table::data.table(
  WellColumn = rep(1:12, each = 8),
  WellRow = rep(LETTERS[1:8], times = 12),
  clid = "A",
  Gnumber = c(rep("untreated", 48), sample(1:5, size = 48, replace = TRUE)),
  Gnumber_2 = c(rep("untreated", 48), sample(1:5, size = 48, replace = TRUE)),
  Concentration = runif(96, min = 0, max = 100),
  ReadoutValue = runif(96, min = 0, max = 100),
  Barcode = rep(c("A", "B"), 48)
  )
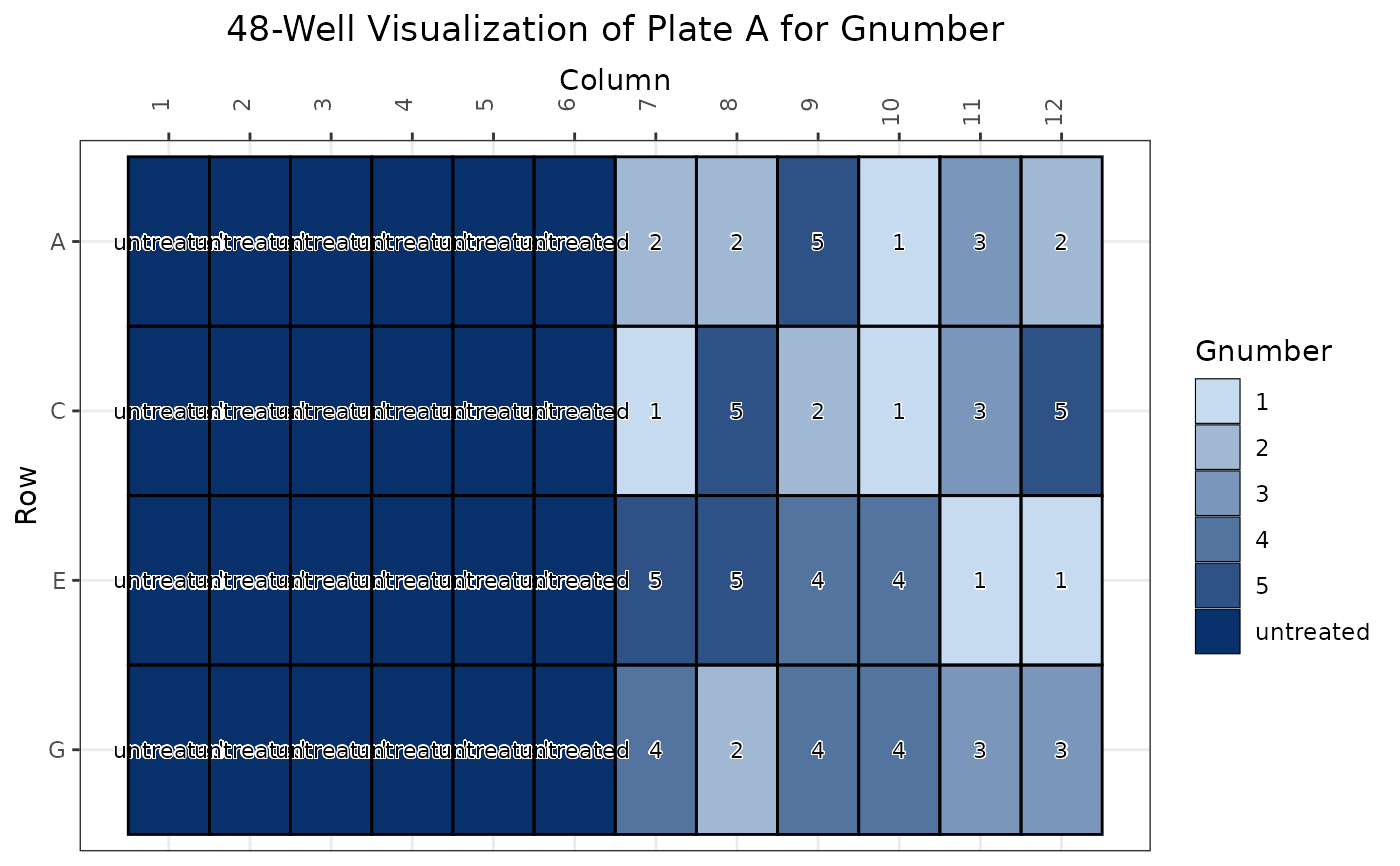
plot_plate(test_data, "Gnumber")[["A"]]