Plot drug response curves for single-agent data
Source:R/plot-sa-response_curve.R
plot_dose_response_sa.RdPlot drug response curves for single-agent data
Usage
plot_dose_response_sa(
  dt_metrics,
  dt_average,
  selection_name,
  group_var,
  group_names = NULL,
  normalization_type = "GR",
  colors_vec = NULL,
  plot_averaged_flag = TRUE,
  plot_fit_flag = TRUE,
  fit_source = "gDR"
)
Arguments
- dt_metrics
data.table representing data from the
Metricsassay, outputted bygDRutils::convert_se_assay_to_dt(se, "Metrics")and single-agentSummarizedExperiment- dt_average
data.table representing data from the
Averagedassay, outputted bygDRutils::convert_se_assay_to_dt(se, "Averaged")and single-agentSummarizedExperiment- selection_name
string name of selected main variable - one value from column
"CellLineName"or"DrugName"- group_var
string name of group variable; one of:
"CellLineName"or"DrugName"- group_names
character vector with names to subset from se (the same dim as
group_var); ifNULLthen all values will be plotted- normalization_type
string with normalization_types to be selected one of: "GR" ("GRvalue") or "RV" ("RelativeViability")
- colors_vec
character vector with colors for
group_names- name or hex value- plot_averaged_flag
logical flag whether plot points with average values
- plot_fit_flag
logical flag whether plot points with fitted values
- fit_source
string source name for metrics
Examples
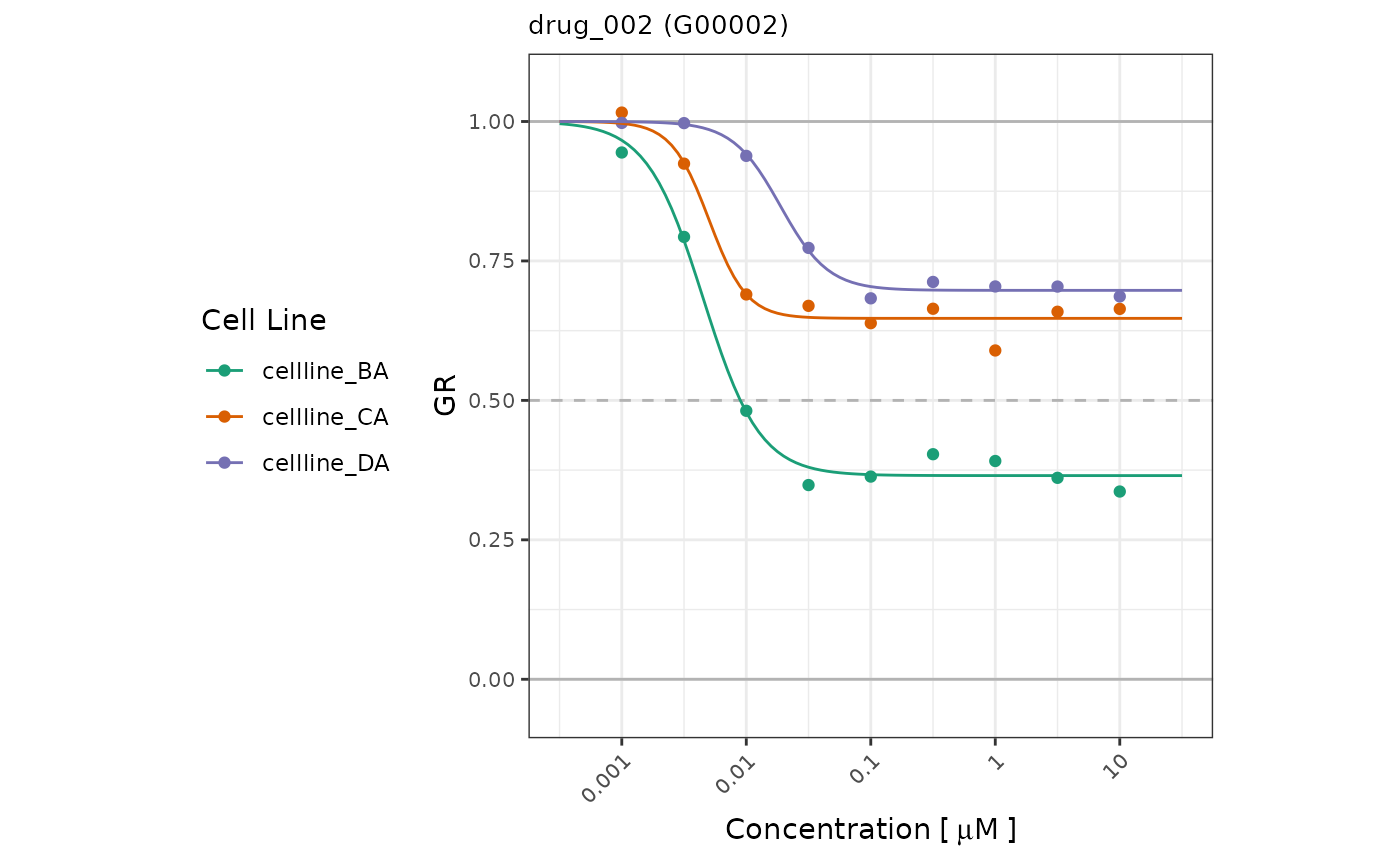
mae <- gDRutils::get_synthetic_data("small")
se <- mae[[gDRutils::get_supported_experiments("sa")]]
selected_drug <- "drug_002"
group_var <- "CellLineName"
dt_metrics <- gDRutils::convert_se_assay_to_dt(se, "Metrics")
dt_average <- gDRutils::convert_se_assay_to_dt(se, "Averaged")
celline_names <- unique(dt_metrics[[group_var]])[1:3]
plot_dose_response_sa(dt_metrics = dt_metrics,
dt_average = dt_average,
selection_name = selected_drug,
group_var = group_var,
group_names = celline_names)
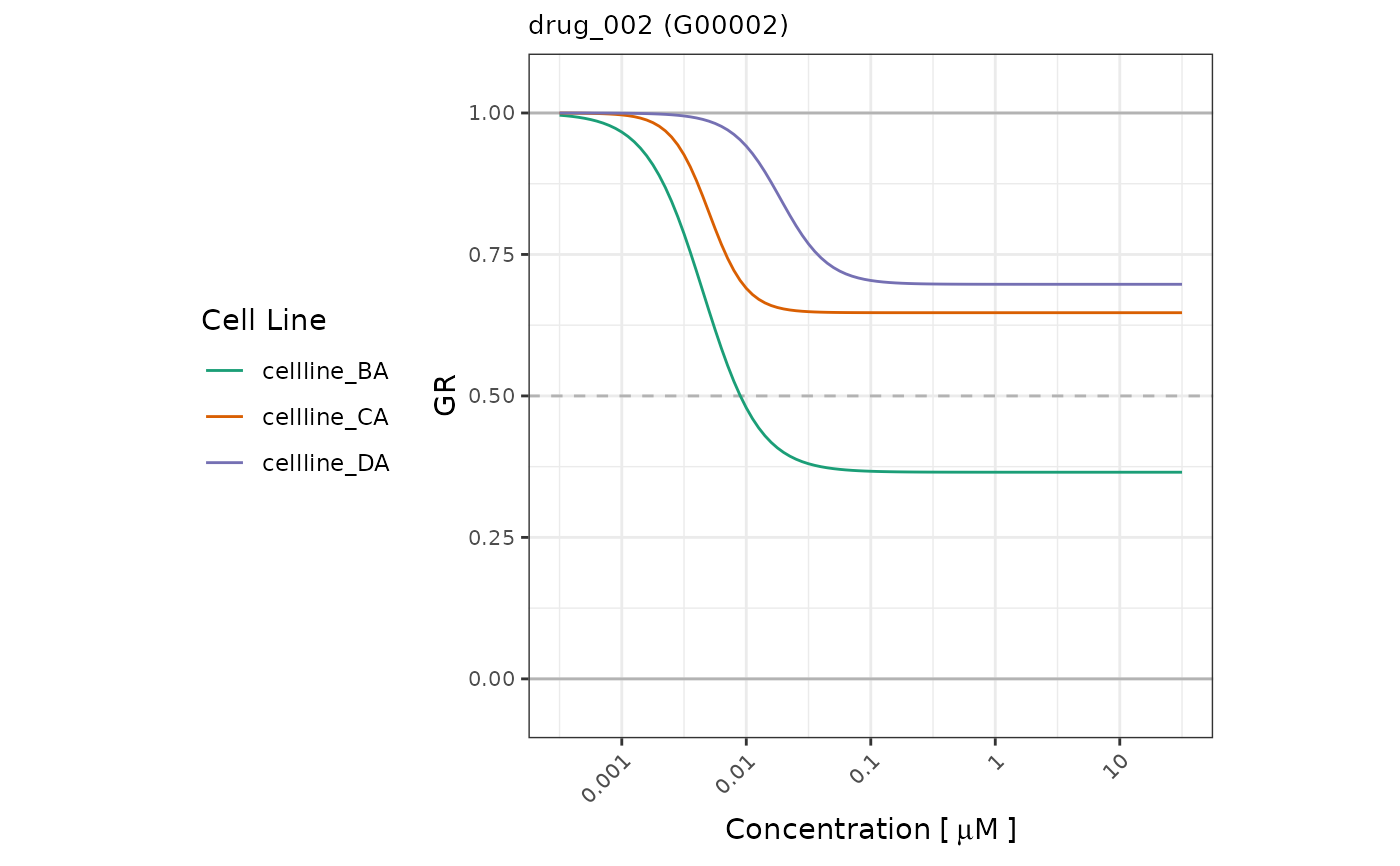
 plot_dose_response_sa(dt_metrics = dt_metrics,
dt_average = NULL,
selection_name = selected_drug,
group_var = group_var,
group_names = celline_names)
plot_dose_response_sa(dt_metrics = dt_metrics,
dt_average = NULL,
selection_name = selected_drug,
group_var = group_var,
group_names = celline_names)
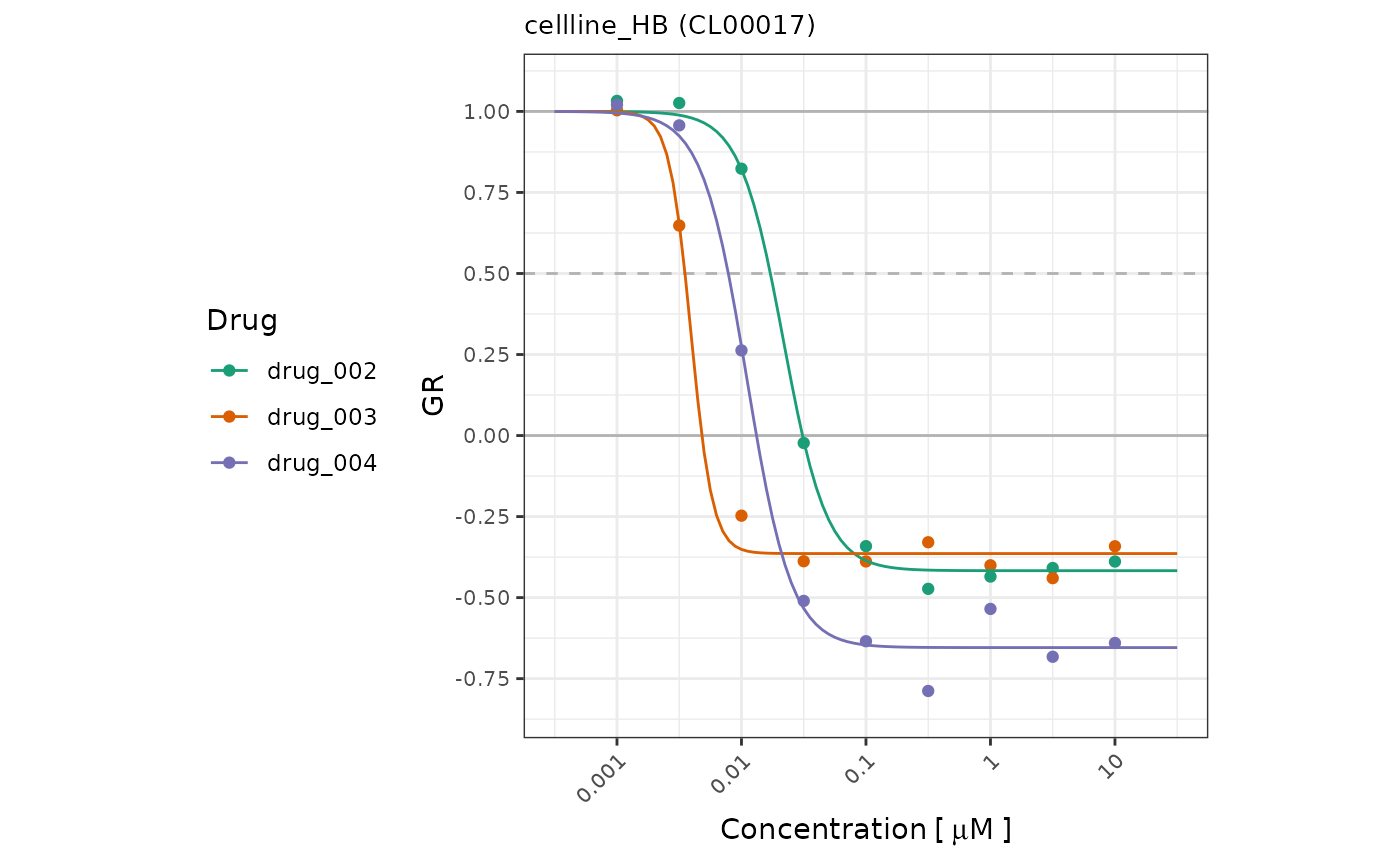
 selected_cellline <- "cellline_HB"
group_var <- "DrugName"
dt_metrics <- gDRutils::convert_se_assay_to_dt(se, "Metrics")
dt_average <- gDRutils::convert_se_assay_to_dt(se, "Averaged")
group_names <- unique(dt_metrics[[group_var]])[1:3]
plot_dose_response_sa(dt_metrics = dt_metrics,
dt_average = dt_average,
selection_name = selected_cellline,
group_var = group_var,
group_names = group_names)
selected_cellline <- "cellline_HB"
group_var <- "DrugName"
dt_metrics <- gDRutils::convert_se_assay_to_dt(se, "Metrics")
dt_average <- gDRutils::convert_se_assay_to_dt(se, "Averaged")
group_names <- unique(dt_metrics[[group_var]])[1:3]
plot_dose_response_sa(dt_metrics = dt_metrics,
dt_average = dt_average,
selection_name = selected_cellline,
group_var = group_var,
group_names = group_names)