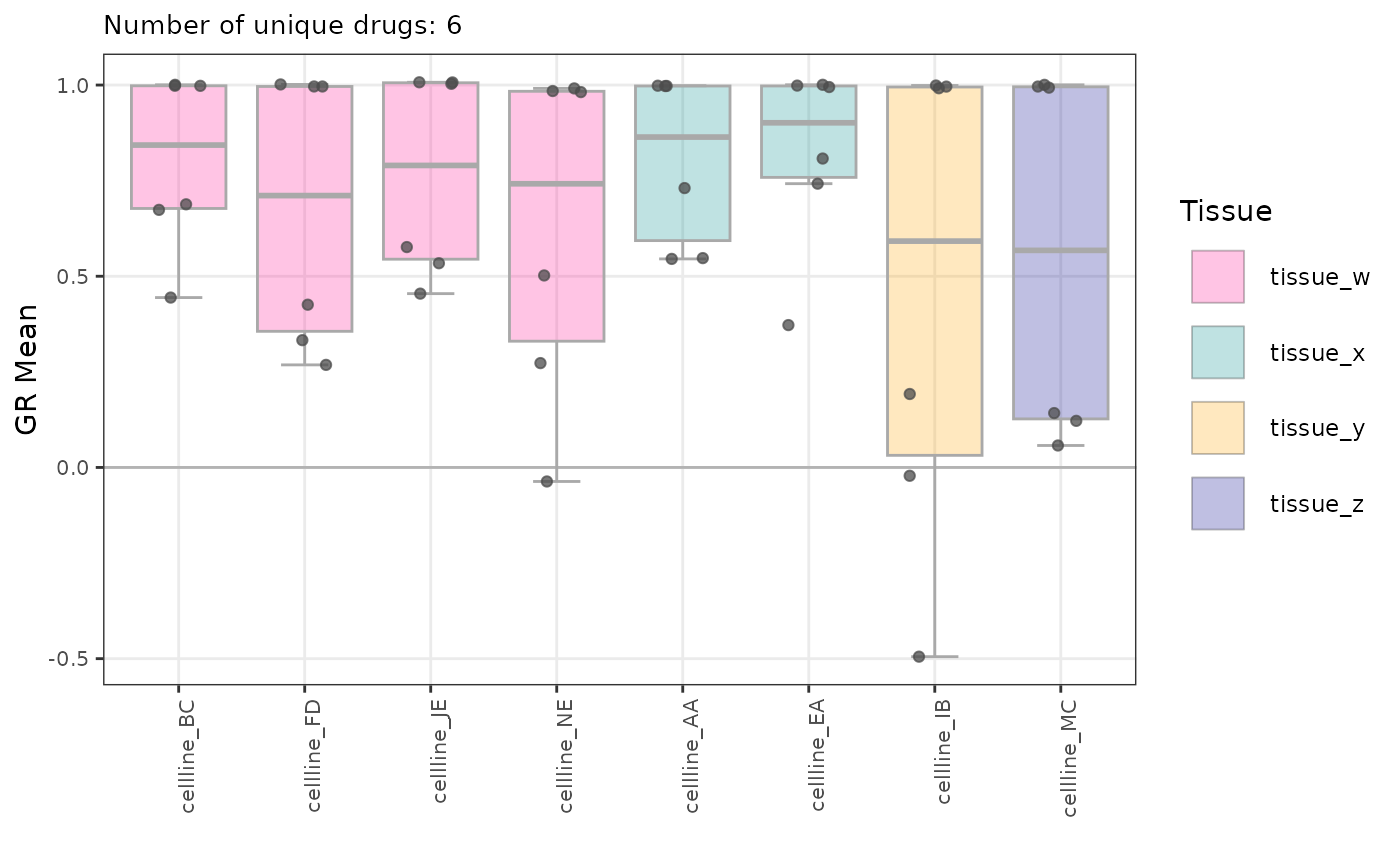
Plot box plots for metric for single-agent data grouped by cell line names
Source:R/plot-boxplot_metric.R
plot_boxplot_metric_sa_by_CLs.RdPlot box plots for metric for single-agent data grouped by cell line names
Usage
plot_boxplot_metric_sa_by_CLs(
  dt_metrics,
  normalization_type = "GR",
  metric = "xc50",
  fit_source = "gDR",
  grouped_flag = FALSE,
  colored_pts_flag = FALSE,
  colors_vec = NULL,
  with_inf = FALSE
)
Arguments
- dt_metrics
data.table representing data from the
Metricsassay, outputted bygDRutils::convert_se_assay_to_dt(se, "Metrics")and single-agentSummarizedExperiment- normalization_type
string with normalization types to be selected one of: "GR" ("GRvalue") or "RV" ("RelativeViability")
- metric
string name of the metric; one of: "xc50" ("GR50" or "IC50" - respectively depending on
normalization_type), "x_max" ("GR Max" or "E Max") or "x_mean" ("GR Mean" or "RV Mean"), but the values from any numeric column can be displayed- fit_source
string source name for metrics
- grouped_flag
a logical flag whether the boxplots should be grouped and colored by
Tissueforgroup_varset as"CellLineName"anddrug_moa- for"DrugName"- colored_pts_flag
a logical flag whether the points should be colored by grouped variable - for
group_varequal"CellLineName"points will be colored by"DrugName"and similarly vice versa- colors_vec
character vector with colors (name or hex value) to color boxplots; for
grouped_flagset asFALSEonly first from vector will be used- with_inf
a logical flag indicating whether infinite values should be shown on boxplots
Author
Janina Smoła janina.smola@external.roche.com
Examples
mae <- gDRutils::get_synthetic_data("combo_matrix")
se <- mae[[gDRutils::get_supported_experiments("sa")]]
dt_metrics <- gDRutils::convert_se_assay_to_dt(se, "Metrics")
plot_boxplot_metric_sa_by_CLs(dt_metrics)
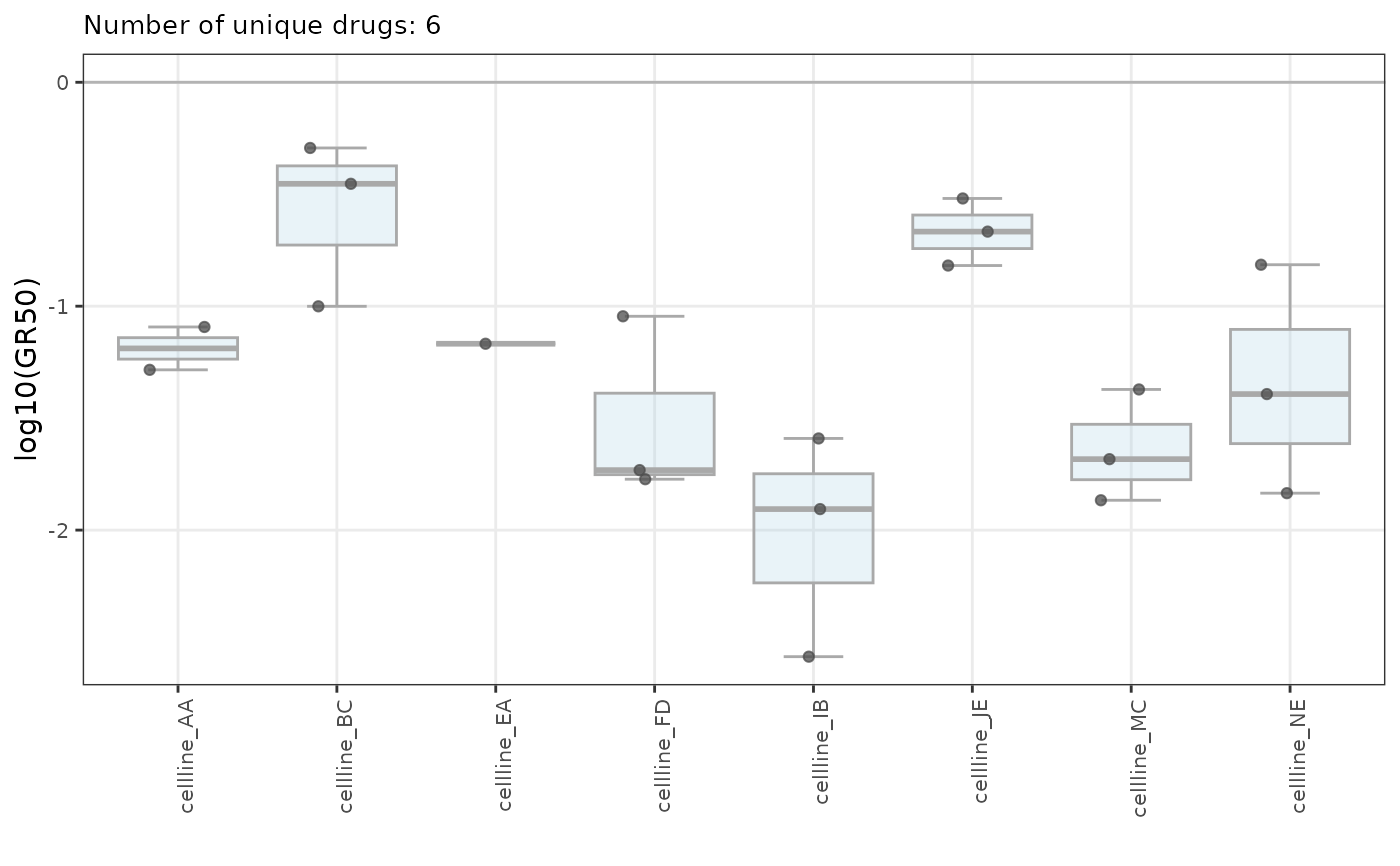 plot_boxplot_metric_sa_by_CLs(dt_metrics,
grouped_flag = TRUE)
plot_boxplot_metric_sa_by_CLs(dt_metrics,
grouped_flag = TRUE)
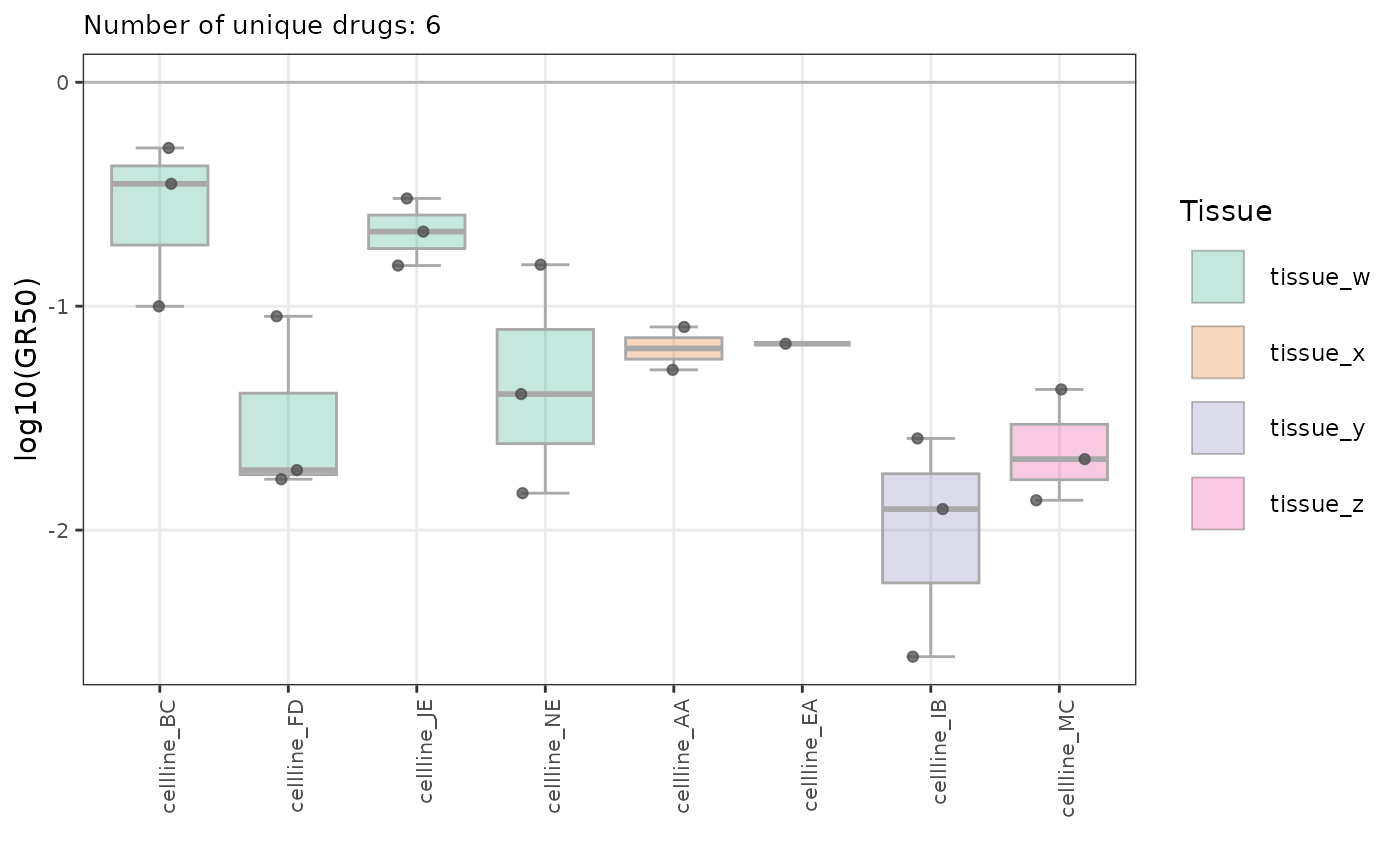 plot_boxplot_metric_sa_by_CLs(dt_metrics,
with_inf = TRUE)
plot_boxplot_metric_sa_by_CLs(dt_metrics,
with_inf = TRUE)
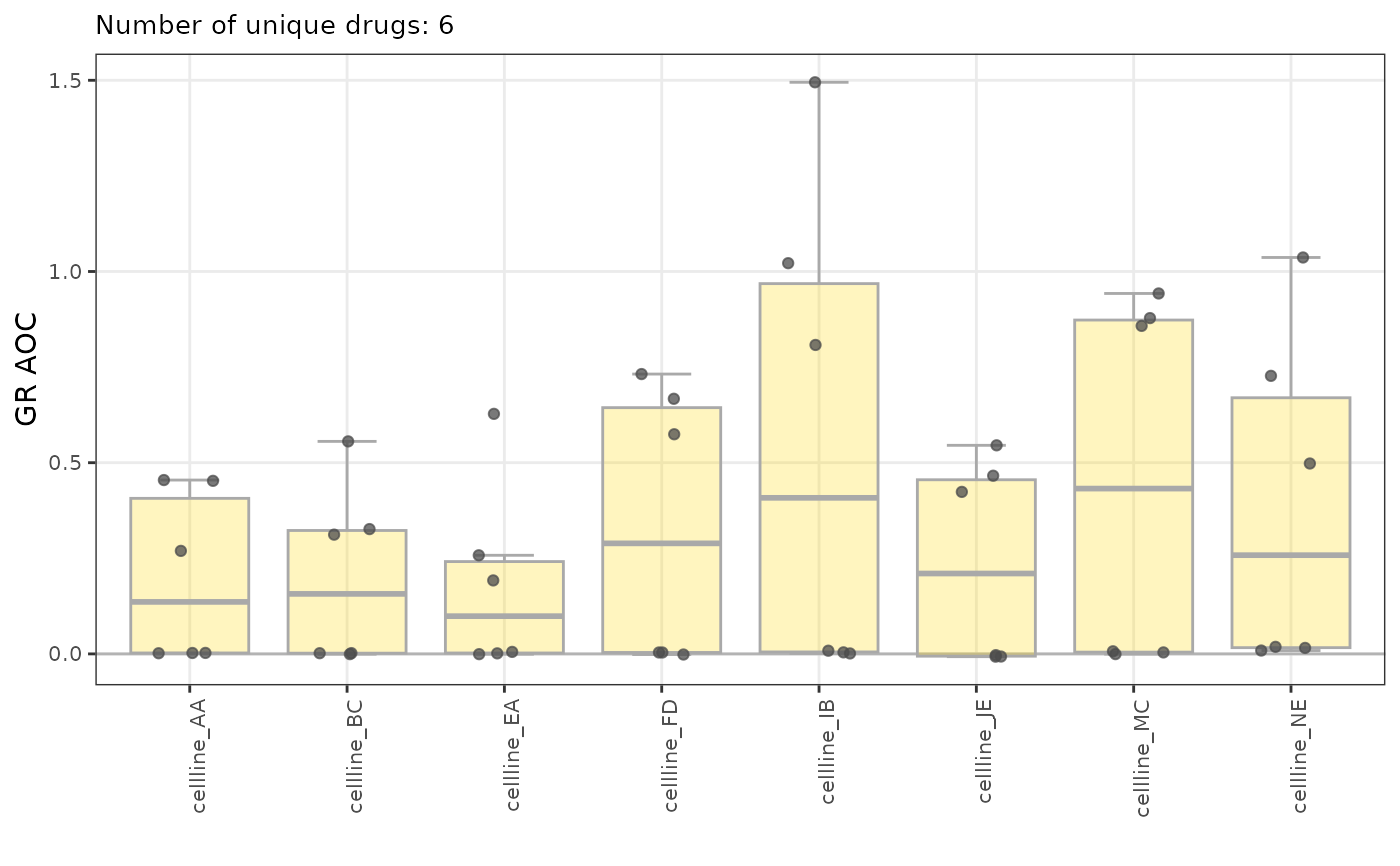
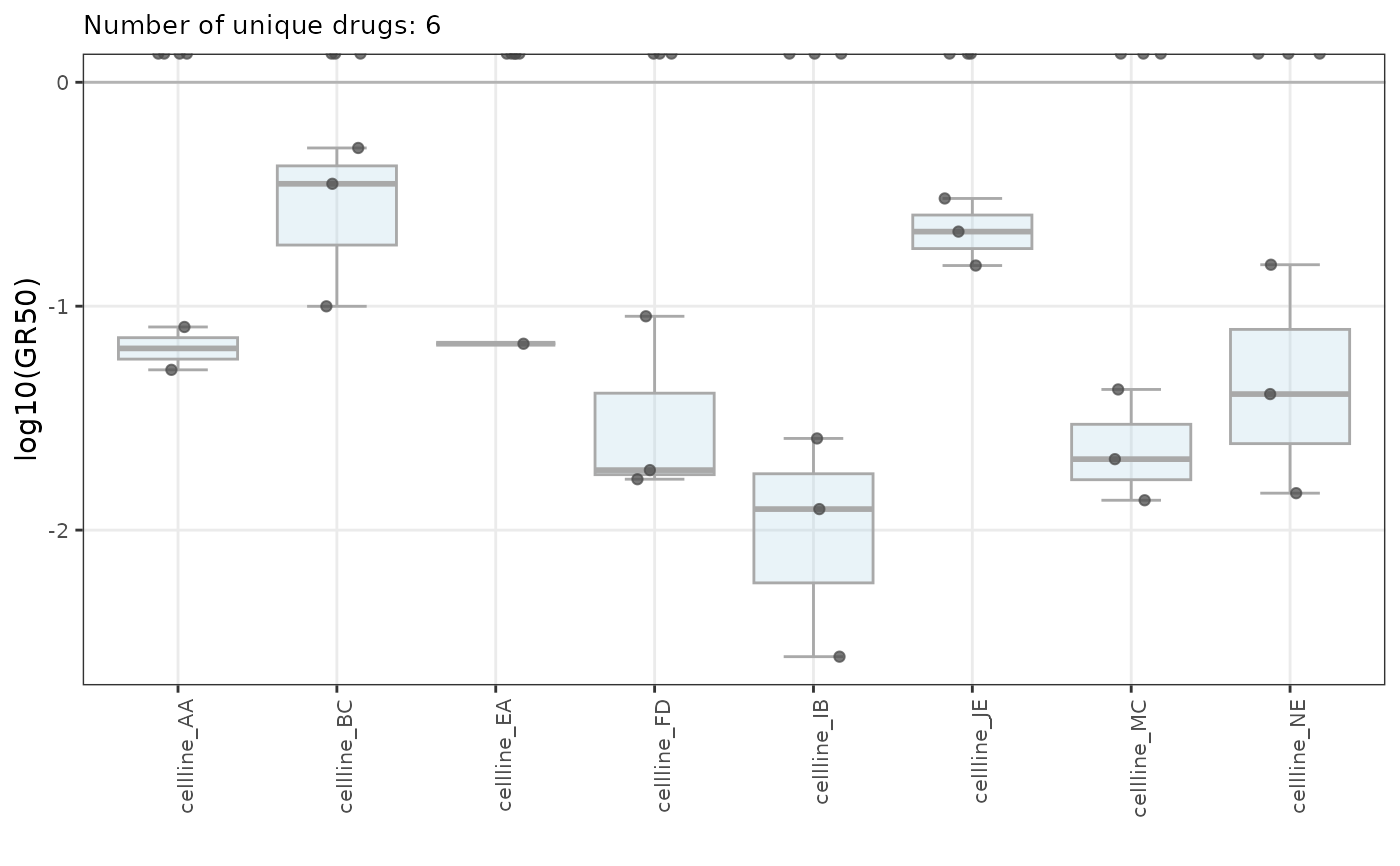 plot_boxplot_metric_sa_by_CLs(dt_metrics,
metric = "x_AOC",
colors_vec = "gold")
plot_boxplot_metric_sa_by_CLs(dt_metrics,
metric = "x_AOC",
colors_vec = "gold")
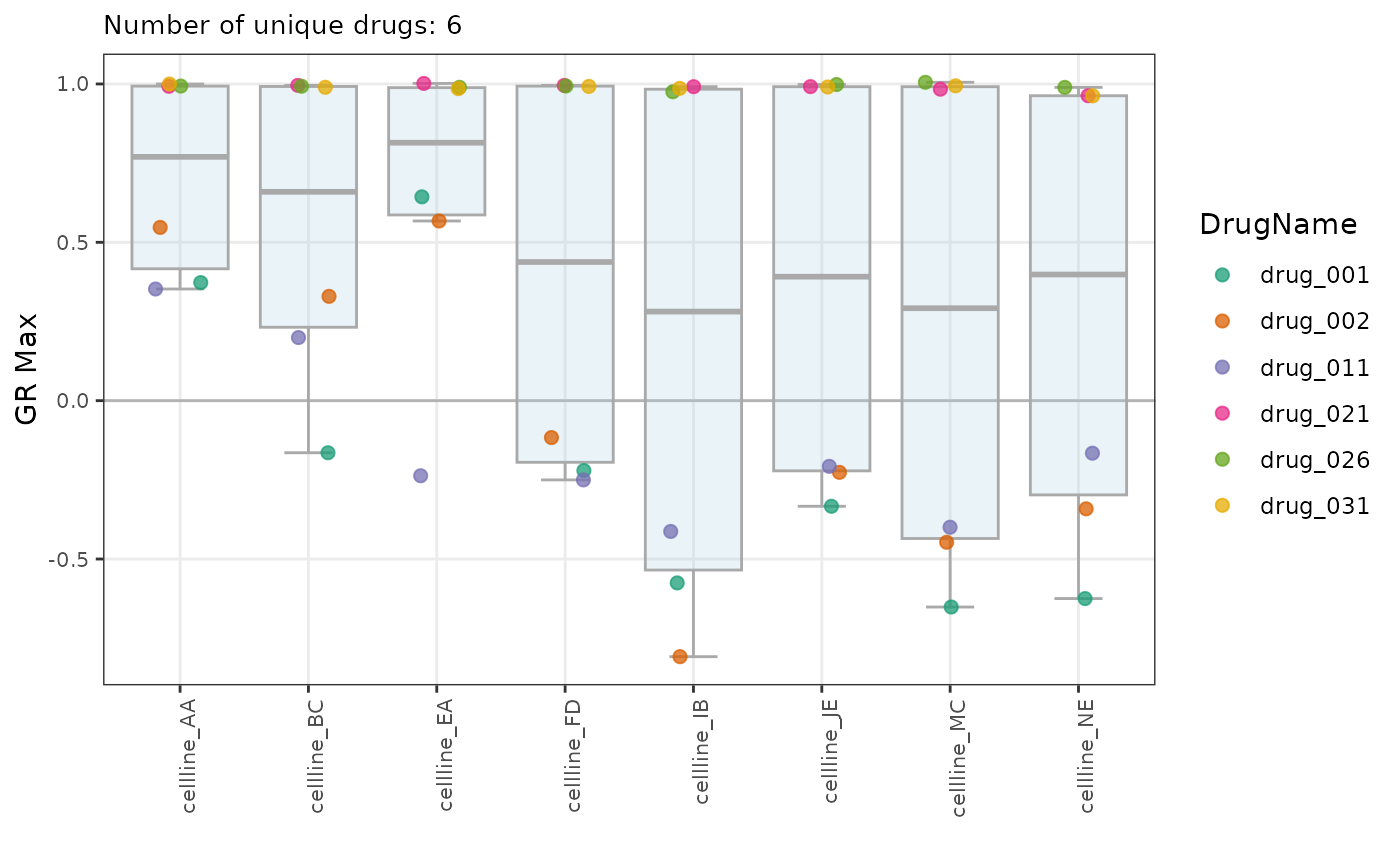
 plot_boxplot_metric_sa_by_CLs(
dt_metrics,
metric = "x_max",
colored_pts_flag = TRUE)
plot_boxplot_metric_sa_by_CLs(
dt_metrics,
metric = "x_max",
colored_pts_flag = TRUE)
 plot_boxplot_metric_sa_by_CLs(
dt_metrics,
metric = "x_mean",
grouped_flag = TRUE,
colors_vec = c("deeppink", "darkcyan", "orange", "darkblue"))
plot_boxplot_metric_sa_by_CLs(
dt_metrics,
metric = "x_mean",
grouped_flag = TRUE,
colors_vec = c("deeppink", "darkcyan", "orange", "darkblue"))