Plot pretty heatmap with annotations for co-dilution data
Source:R/plot-pheatmap.R
pheatmap_with_anno_cd.RdPlot pretty heatmap with annotations for co-dilution data
Usage
pheatmap_with_anno_cd(
  dt_metrics,
  normalization_type = "GR",
  metric = "xc50",
  fit_source = "gDR",
  hm_title = NA,
  colors_vec = NULL,
  no_breaks = 50,
  cluster_rows = TRUE,
  cluster_cols = TRUE,
  distfun = compute_distances,
  annotation_row = NULL,
  annotation_col = NULL,
  annotation_colors = NULL
)
Arguments
- dt_metrics
data.tablerepresenting data from theMetricsassay, outputted bygDRutils::convert_se_assay_to_dtand co-dilutionSummarizedExperiment- normalization_type
string with normalization types to be selected one of: "GR" ("GRvalue") or "RV" ("RelativeViability")
- metric
string name of the metric; one of: "xc50" ("GR50" or "IC50" - respectively depending on
normalization_type), "x_max" ("GR Max" or "E Max") or "x_mean" ("GR Mean" or "RV Mean")- fit_source
string source name for metrics
- hm_title
string plot title
- colors_vec
character vector of colors (valid name or hex) used in heatmap; note that the first color will be assigned to the min value, and the last one - to the max
- no_breaks
numeric number of breaks on scale used for mapping values to colors
- cluster_rows
logical flag whether indicating rows should be clustered; the dendrogram will not be shown for the matrix with any dimension greater than 200.
- cluster_cols
logical flag indicating whether columns should be clustered; the dendrogram will not be shown for the matrix with any dimension greater than 200.
- distfun
function used to compute the distance (dissimilarity) between both rows and columns; used for the dendrogram when
cluster_rowsorcluster_colsis set to TRUE the default iscompute_distancesusing Spearman method.- annotation_row
data.tablethat specifies the annotations shown on the left side of the heatmap. Each row defines the features for a specific row. The rows in the data and in the annotation are matched using corresponding names from the requiredDrugName,DrugName_2andConcentration_2columns. Note that color schemes takes into account if the variable is continuous or discrete.- annotation_col
data.tablethat specifies the annotations shown above the heatmap. Each row defines the features for a specific column. The columns in the data and in the annotation are matched using corresponding names from the requiredCellLineNamecolumn. Note that color schemes takes into account if the variable is continuous or discrete.- annotation_colors
named list for specifying
annotation_colandannotation_rowtrack colors manually; note list is named with annotation name (column names ofannotation_row- withoutDrugNameand column names ofannotation_col- withoutCellLineName), each list item is named vector with valid color name for each value described inannotation_rowand inannotation_col, respectively. Not described elements will be colored by default.
Value
A named list with elements:
dataa list containing the information visualized in the heatmap:matrixdata shown in the heatmap for the selected metric.annotation_rowa table with row annotations (forDrugName), if provided.annotation_cola table with column annotations (forCellLineName), if provided.
pheatmapobject containing the heatmap itself.
Author
Janina Smoła janina.smola@external.roche.com
Examples
mae <- gDRutils::get_synthetic_data("combo_codilution_small")
se <- mae[[gDRutils::get_supported_experiments("cd")]]
dt_metrics <- gDRutils::convert_se_assay_to_dt(se = se,
assay_name = "Metrics")
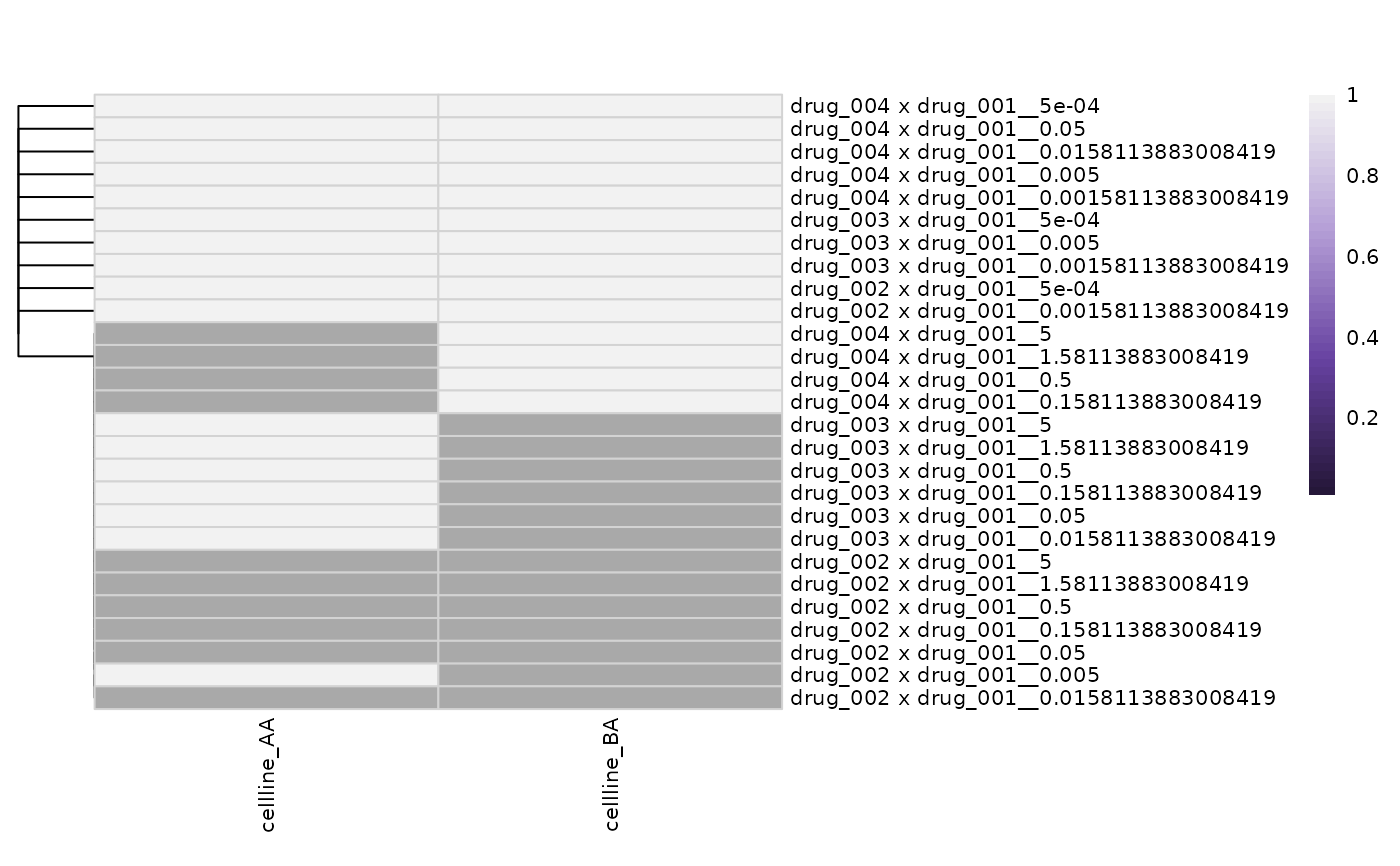
output <- pheatmap_with_anno_cd(dt_metrics = dt_metrics)
hm_1 <- output[["heatmap"]]
patchwork::wrap_elements(hm_1[["gtable"]])
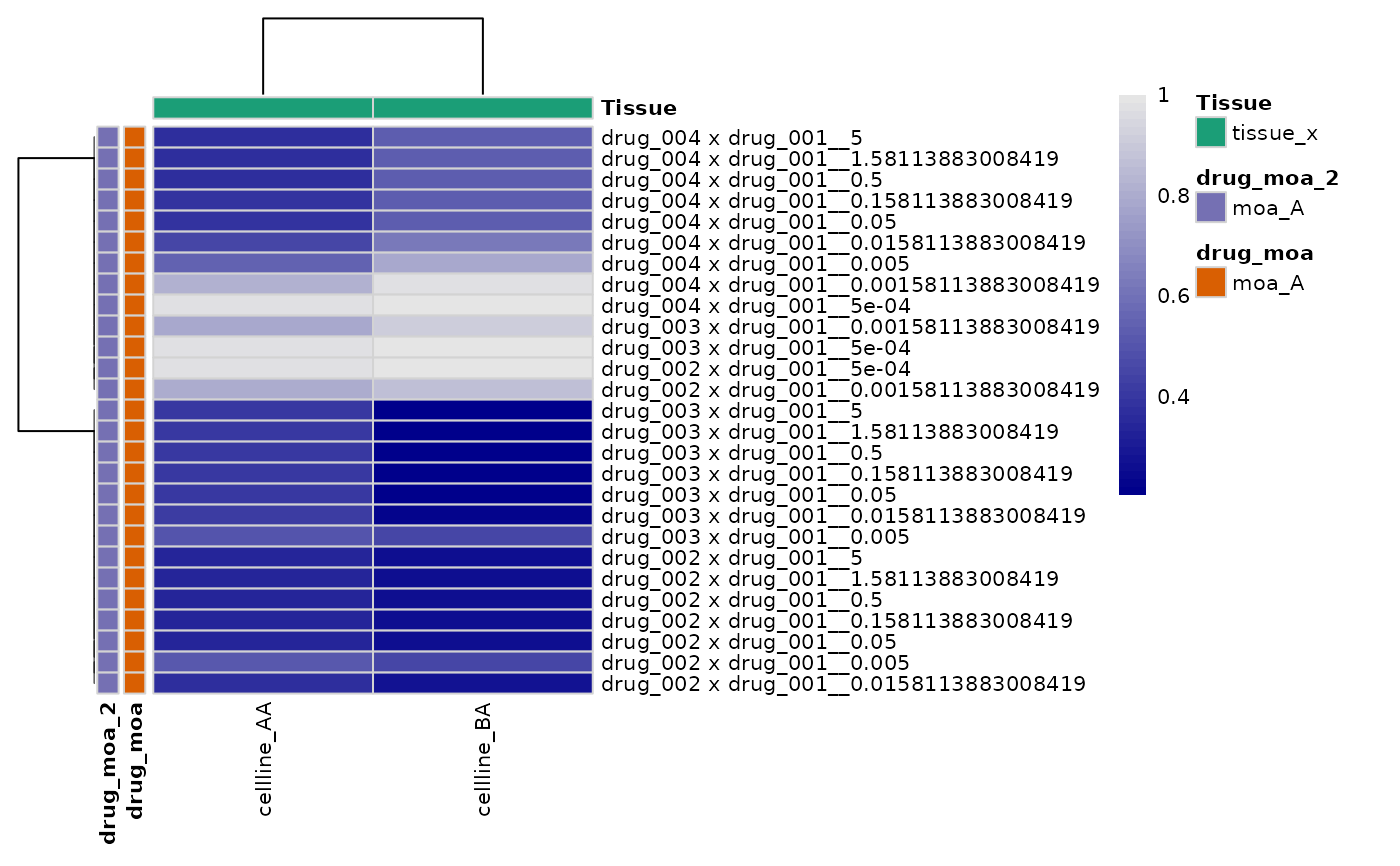
 annotation_manual_col <-
unique(dt_metrics[, c("CellLineName", "Tissue"), with = FALSE])
annotation_manual_row <-
unique(dt_metrics[, c("DrugName", "DrugName_2", "Concentration_2",
"drug_moa", "drug_moa_2"),
with = FALSE])
annotation_map <-
get_ann_color_map(unique(dt_metrics[, c("Tissue", "drug_moa", "drug_moa_2"), with = FALSE]))
output <- pheatmap_with_anno_cd(dt_metrics = dt_metrics,
normalization_type = "RV",
metric = "x_mean",
colors_vec = c("darkblue", "grey90"),
annotation_row = annotation_manual_row,
annotation_col = annotation_manual_col,
annotation_colors = annotation_map)
hm_2 <- output[["heatmap"]]
patchwork::wrap_elements(hm_2[["gtable"]])
annotation_manual_col <-
unique(dt_metrics[, c("CellLineName", "Tissue"), with = FALSE])
annotation_manual_row <-
unique(dt_metrics[, c("DrugName", "DrugName_2", "Concentration_2",
"drug_moa", "drug_moa_2"),
with = FALSE])
annotation_map <-
get_ann_color_map(unique(dt_metrics[, c("Tissue", "drug_moa", "drug_moa_2"), with = FALSE]))
output <- pheatmap_with_anno_cd(dt_metrics = dt_metrics,
normalization_type = "RV",
metric = "x_mean",
colors_vec = c("darkblue", "grey90"),
annotation_row = annotation_manual_row,
annotation_col = annotation_manual_col,
annotation_colors = annotation_map)
hm_2 <- output[["heatmap"]]
patchwork::wrap_elements(hm_2[["gtable"]])
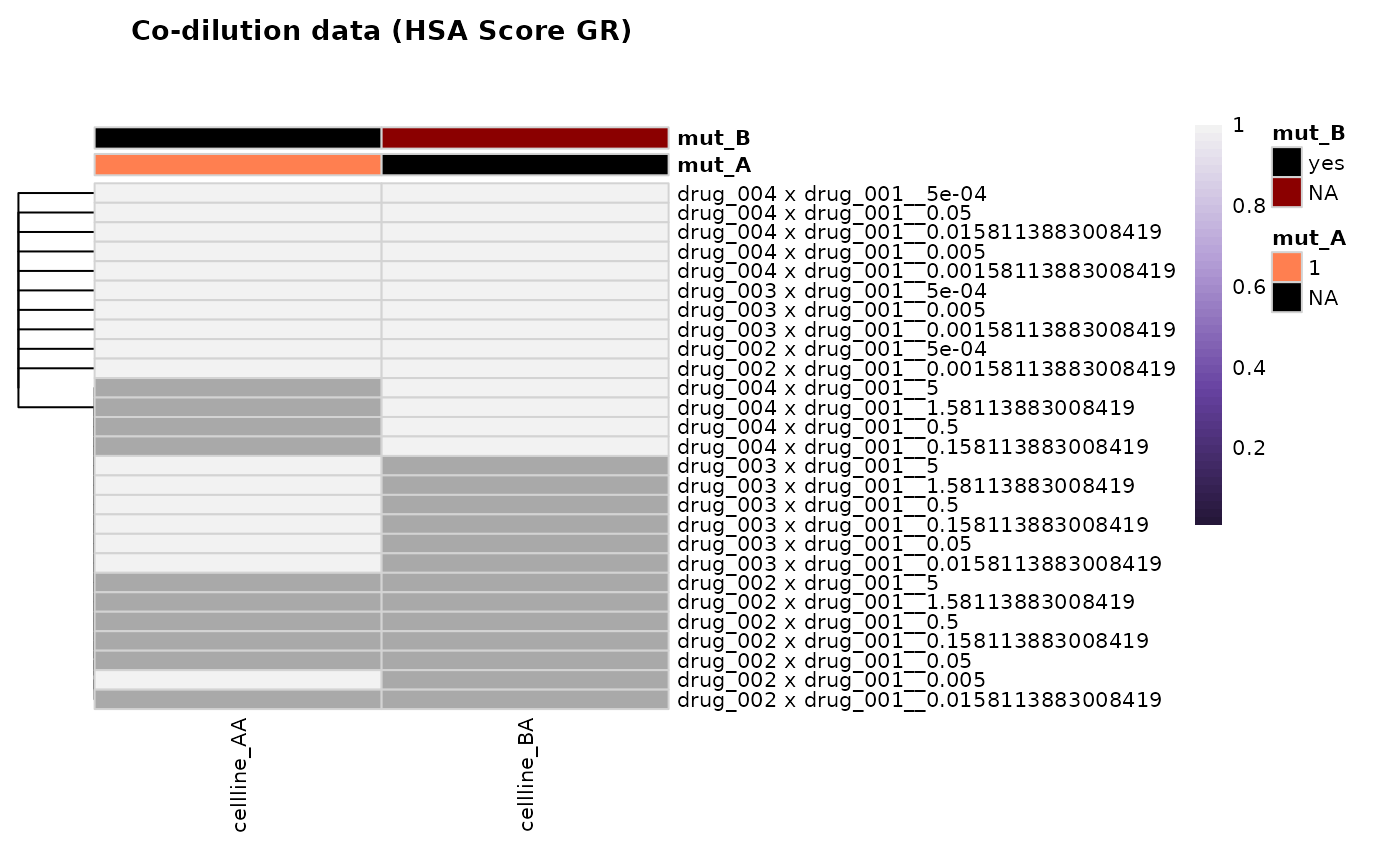
 annotation_manual <- data.table::data.table(
CellLineName =
c("cellline_AA", "cellline_EA", "cellline_IB", "cellline_MC", "cellline_BC"),
mut_A = c(1, 1, 1, 0, 0),
mut_B = c("yes", "yes", "no", "no", "no")
)
annotation_map <- list(
mut_A = c("1" = "coral", "0" = "cadetblue"),
mut_B = c("yes" = "black", "no" = "grey90")
)
output <- pheatmap_with_anno_cd(dt_metrics = dt_metrics,
annotation_col = annotation_manual,
annotation_colors = annotation_map,
hm_title = get_hm_title(
normalization_type = "GR",
metric = "hsa_score",
dataset_name = "Co-dilution data"))
hm_3 <- output[["heatmap"]]
patchwork::wrap_elements(hm_3[["gtable"]])
annotation_manual <- data.table::data.table(
CellLineName =
c("cellline_AA", "cellline_EA", "cellline_IB", "cellline_MC", "cellline_BC"),
mut_A = c(1, 1, 1, 0, 0),
mut_B = c("yes", "yes", "no", "no", "no")
)
annotation_map <- list(
mut_A = c("1" = "coral", "0" = "cadetblue"),
mut_B = c("yes" = "black", "no" = "grey90")
)
output <- pheatmap_with_anno_cd(dt_metrics = dt_metrics,
annotation_col = annotation_manual,
annotation_colors = annotation_map,
hm_title = get_hm_title(
normalization_type = "GR",
metric = "hsa_score",
dataset_name = "Co-dilution data"))
hm_3 <- output[["heatmap"]]
patchwork::wrap_elements(hm_3[["gtable"]])