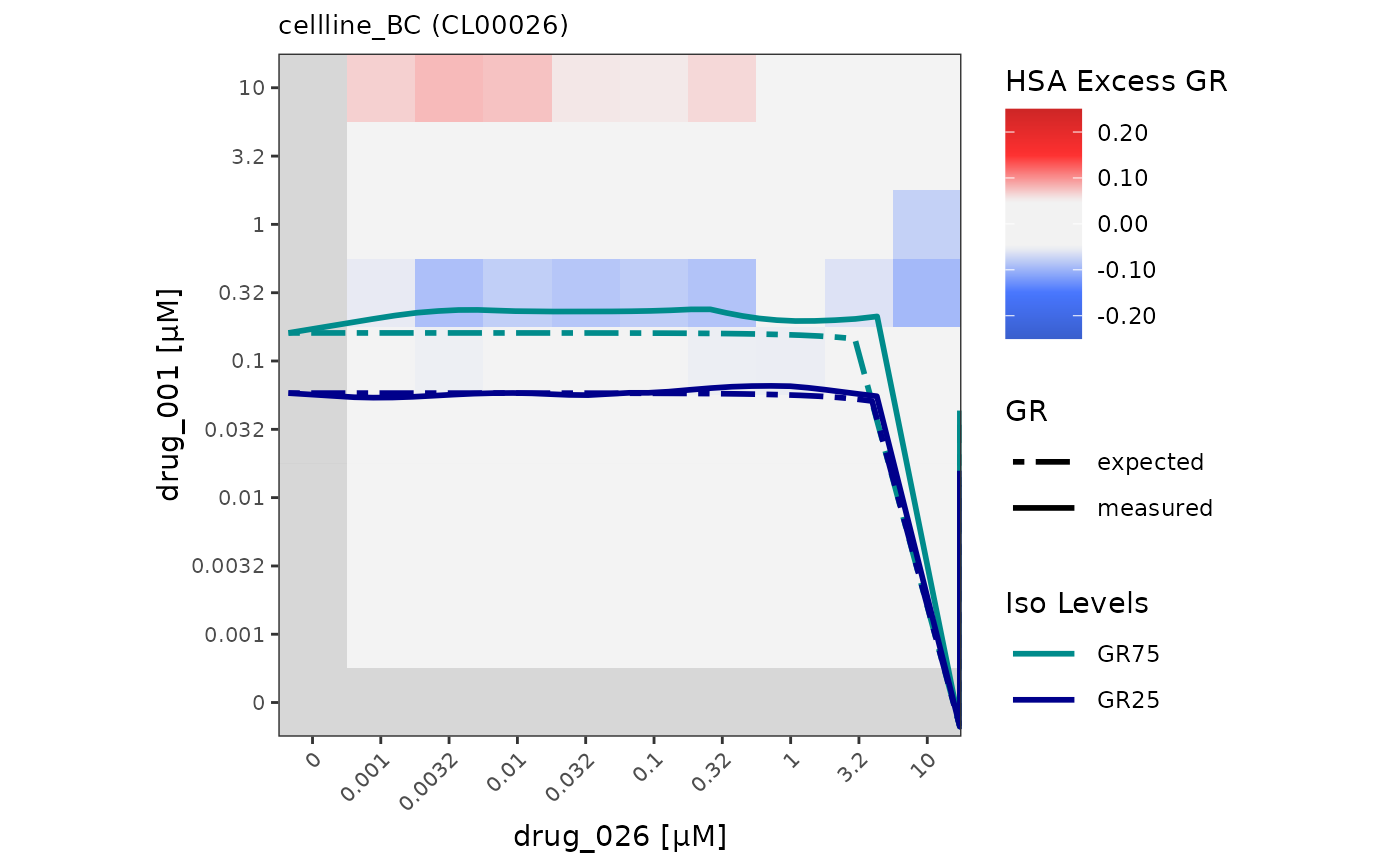
Plot heatmaps of averaged values for combination data
Source:R/plot-combo-heatmaps.R
heatmap_combo_with_isoref.RdPlot heatmaps of averaged values for combination data
Usage
heatmap_combo_with_isoref(
  dt_excess,
  dt_isobolograms,
  drug1_name,
  drug2_name,
  cl_name,
  normalization_type = "GR",
  metric = "smooth",
  iso_levels = "0.5",
  colors_vec = NULL,
  colors_vec_iso = NULL,
  no_breaks = 50,
  swap_axes = FALSE
)
Arguments
- dt_excess
data.table representing data from the
excessassay, outputted bygDRutils::convert_se_assay_to_dt(se, "excess")and comboSummarizedExperiment- dt_isobolograms
data.table representing data from the
isobologramsassay, outputted bygDRutils::convert_se_assay_to_dt(se, "isobolograms")and comboSummarizedExperiment- drug1_name
string with drug name to be plotted (identifiers
DrugName)- drug2_name
string with co-drug name to be plotted (identifiers
DrugName_2)- cl_name
string with cell line to be plotted (identifiers
CellLineName)- normalization_type
string with normalization_types to be selected one of: "GR" ("GRvalue") or "RV" ("RelativeViability")
- metric
string name of the combo metric; one of: "smooth" ("Smooth GR" or "Smooth RV" - respectively depending on
normalization_type) "hsa_excess" ("Bliss Excess GR" or "Bliss Excess RV") or "bliss_excess" ("Bliss Excess GR" or "Bliss Excess RV")- iso_levels
character vector with isobologram levels to be selected; when
NULL- no isolines will be displayed- colors_vec
character vector of colors (valid name or hex) used in heatmap; the default depends on
metric: for "smooth" - the dark purple-light grey palette and for "hsa_excess" and "bliss_excess" - the blue-light grey-red color scale- colors_vec_iso
character vector of colors (valid name or hex) used for the isolines; the default is the dark red-orange palette
- no_breaks
numeric number of breaks on scale
- swap_axes
logical flag whether to swap the axes with drugs of the heatmap
Value
ggplot object containing heatmap for fitted values and reference data
for isobolograms for selected drug and co-drug and selected cell line
Examples
cl_name <- "cellline_BC"
drug1_name <- "drug_001"
drug2_name <- "drug_026"
mae <- gDRutils::get_synthetic_data("combo_matrix")
se <- mae[[gDRutils::get_supported_experiments("combo")]]
dt_excess <- gDRutils::convert_se_assay_to_dt(se, "excess")
dt_isobolograms <- gDRutils::convert_se_assay_to_dt(se, "isobolograms")
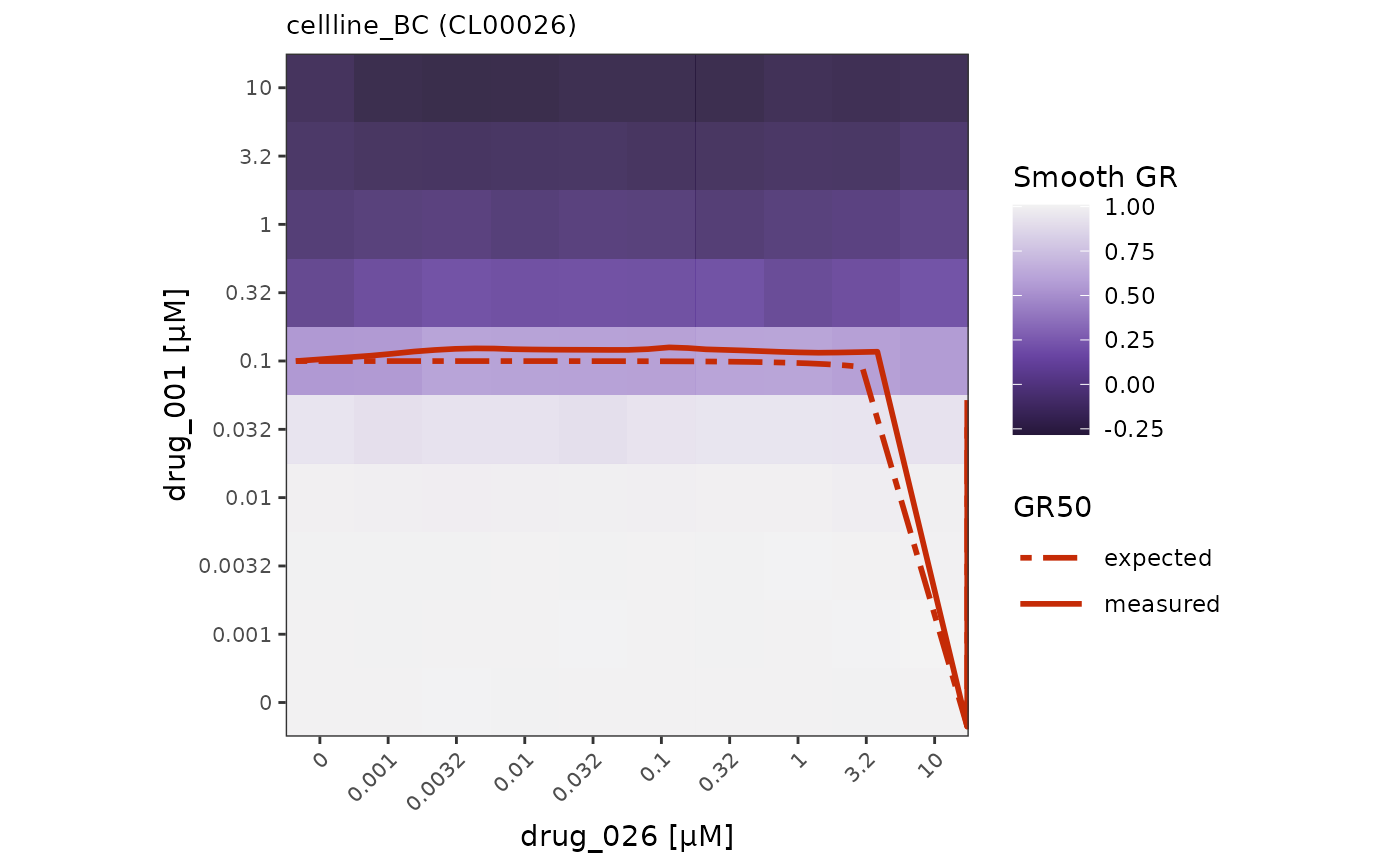
heatmap_combo_with_isoref(dt_excess,
dt_isobolograms,
drug1_name, drug2_name,
cl_name)
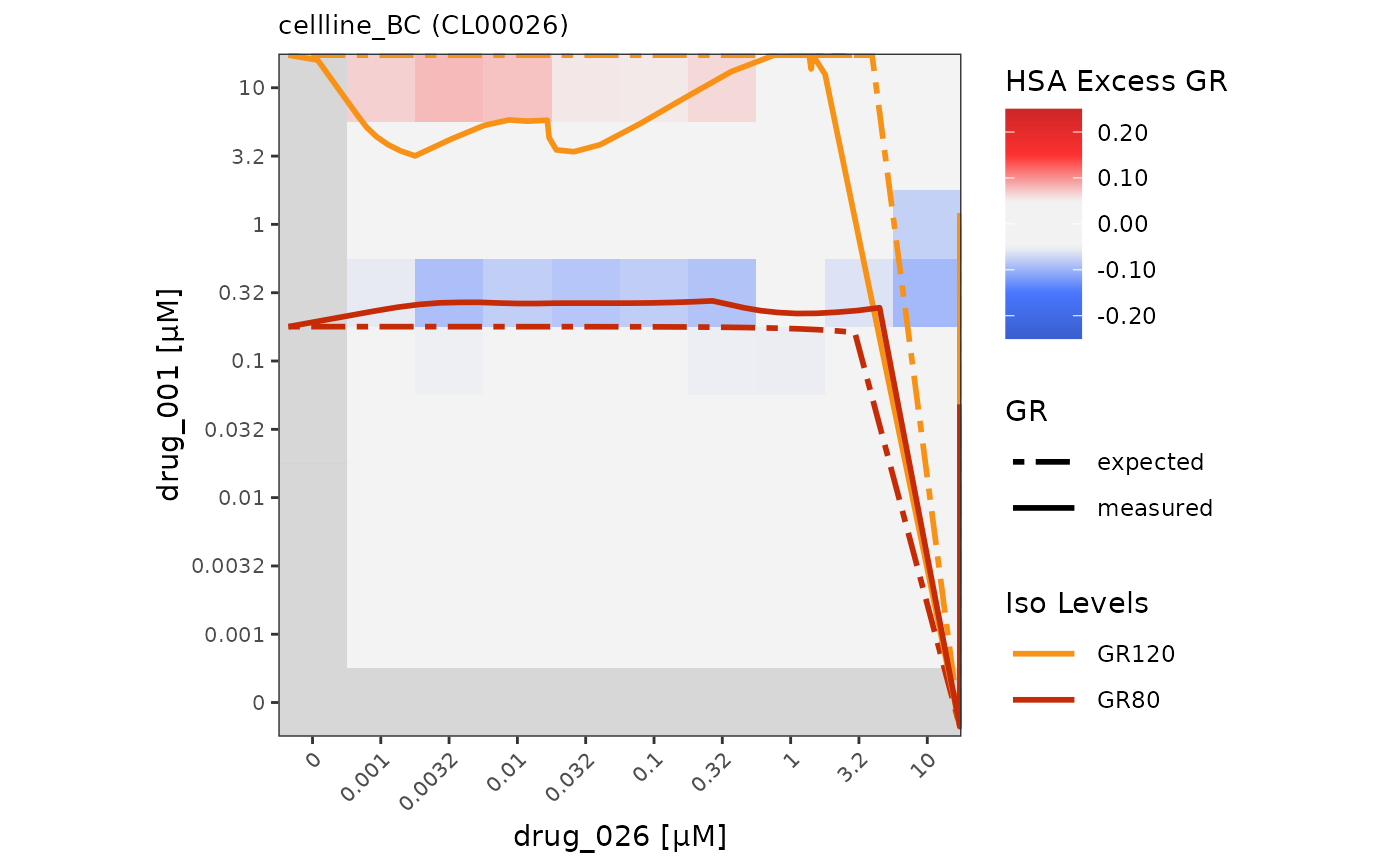
 heatmap_combo_with_isoref(dt_excess,
dt_isobolograms,
drug1_name, drug2_name,
cl_name,
metric = "hsa_excess",
iso_levels = c("-0.2", "0.2"))
heatmap_combo_with_isoref(dt_excess,
dt_isobolograms,
drug1_name, drug2_name,
cl_name,
metric = "hsa_excess",
iso_levels = c("-0.2", "0.2"))
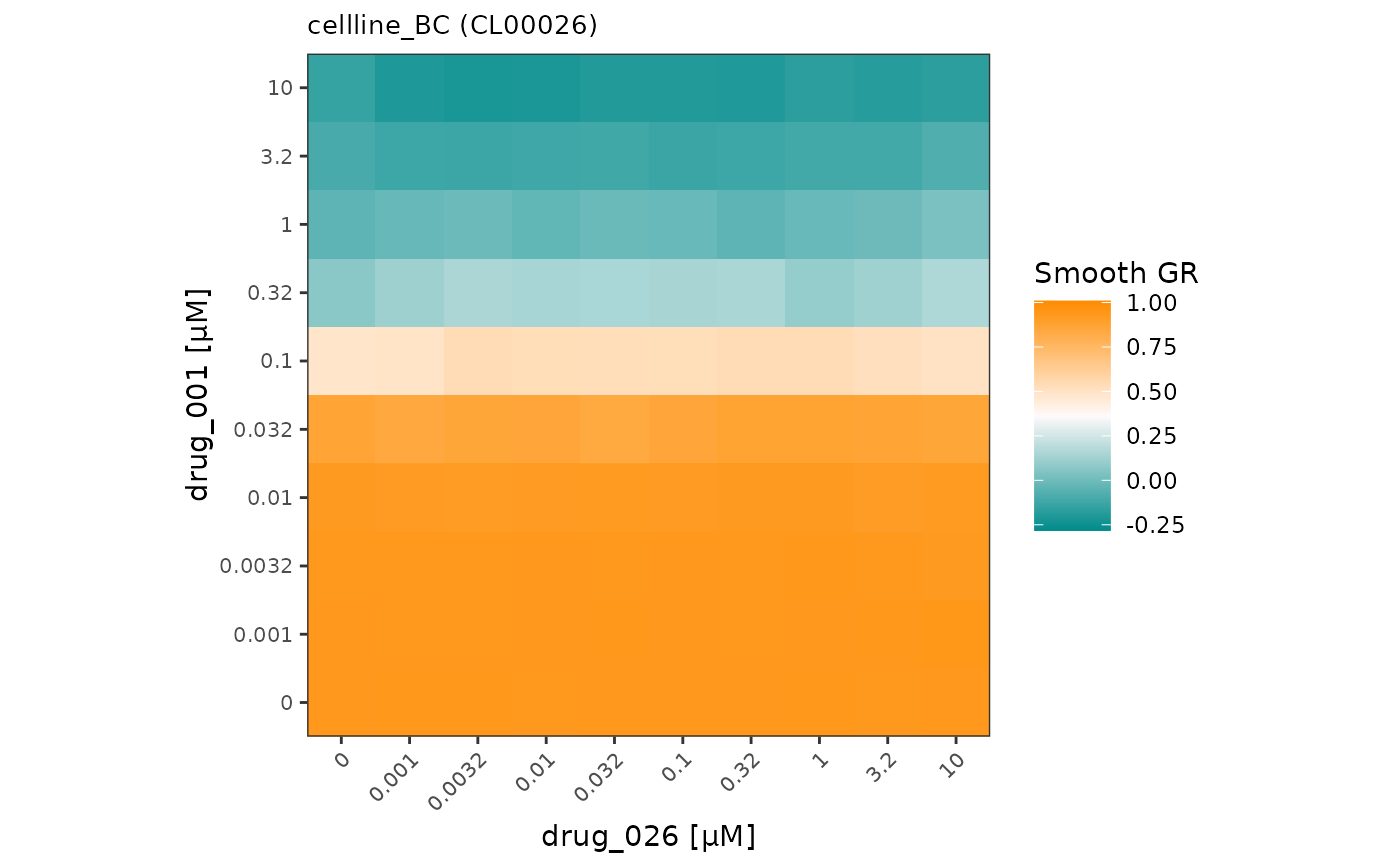
 heatmap_combo_with_isoref(dt_excess,
dt_isobolograms,
drug1_name, drug2_name,
cl_name,
iso_levels = NULL,
colors_vec = c("darkcyan", "snow", "darkorange"))
heatmap_combo_with_isoref(dt_excess,
dt_isobolograms,
drug1_name, drug2_name,
cl_name,
iso_levels = NULL,
colors_vec = c("darkcyan", "snow", "darkorange"))
 heatmap_combo_with_isoref(dt_excess,
dt_isobolograms,
drug1_name, drug2_name,
cl_name,
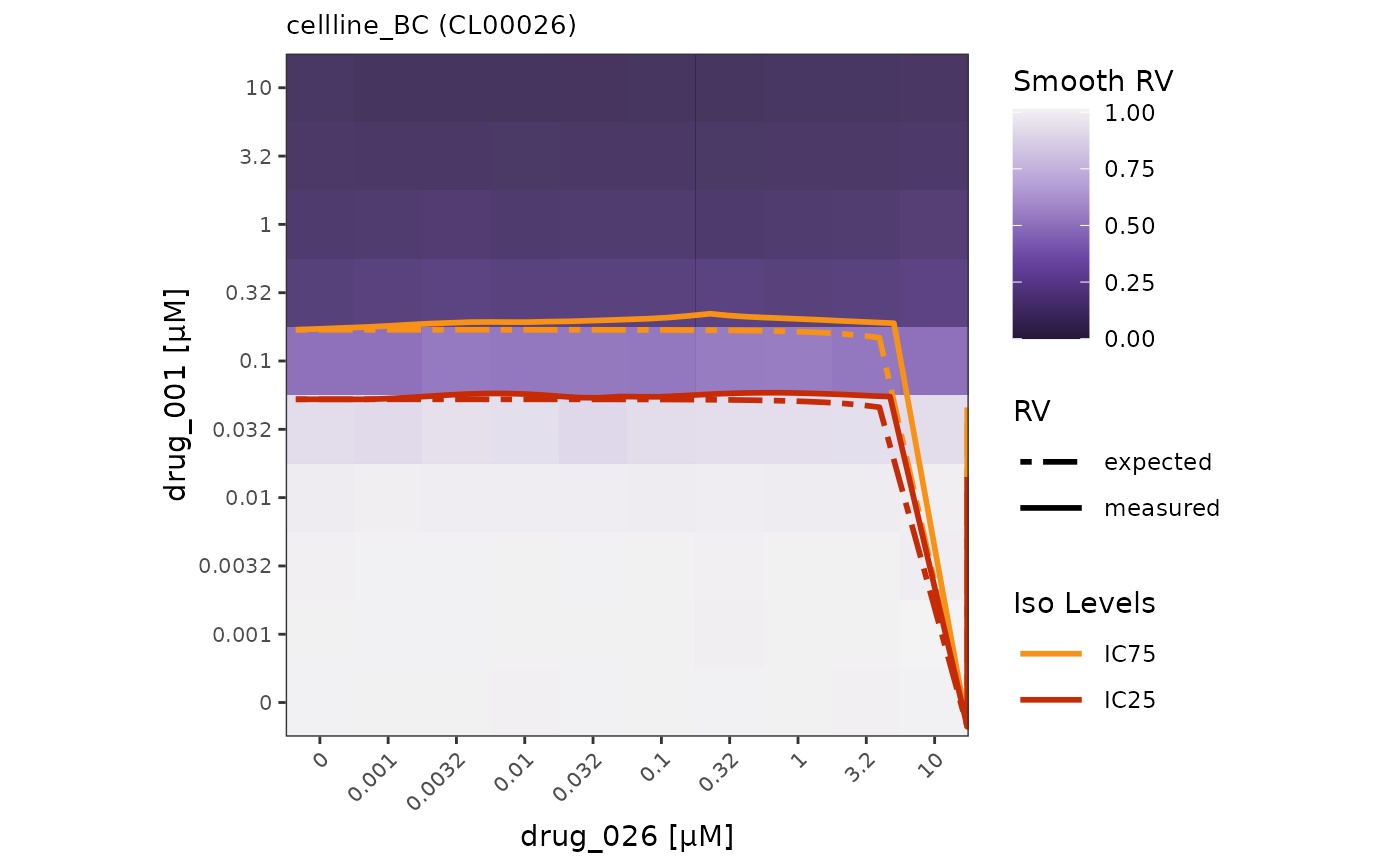
normalization_type = "RV",
iso_levels = c("0.25", "0.75"),
swap_axes = FALSE)
heatmap_combo_with_isoref(dt_excess,
dt_isobolograms,
drug1_name, drug2_name,
cl_name,
normalization_type = "RV",
iso_levels = c("0.25", "0.75"),
swap_axes = FALSE)
 heatmap_combo_with_isoref(dt_excess,
dt_isobolograms,
drug1_name, drug2_name,
cl_name,
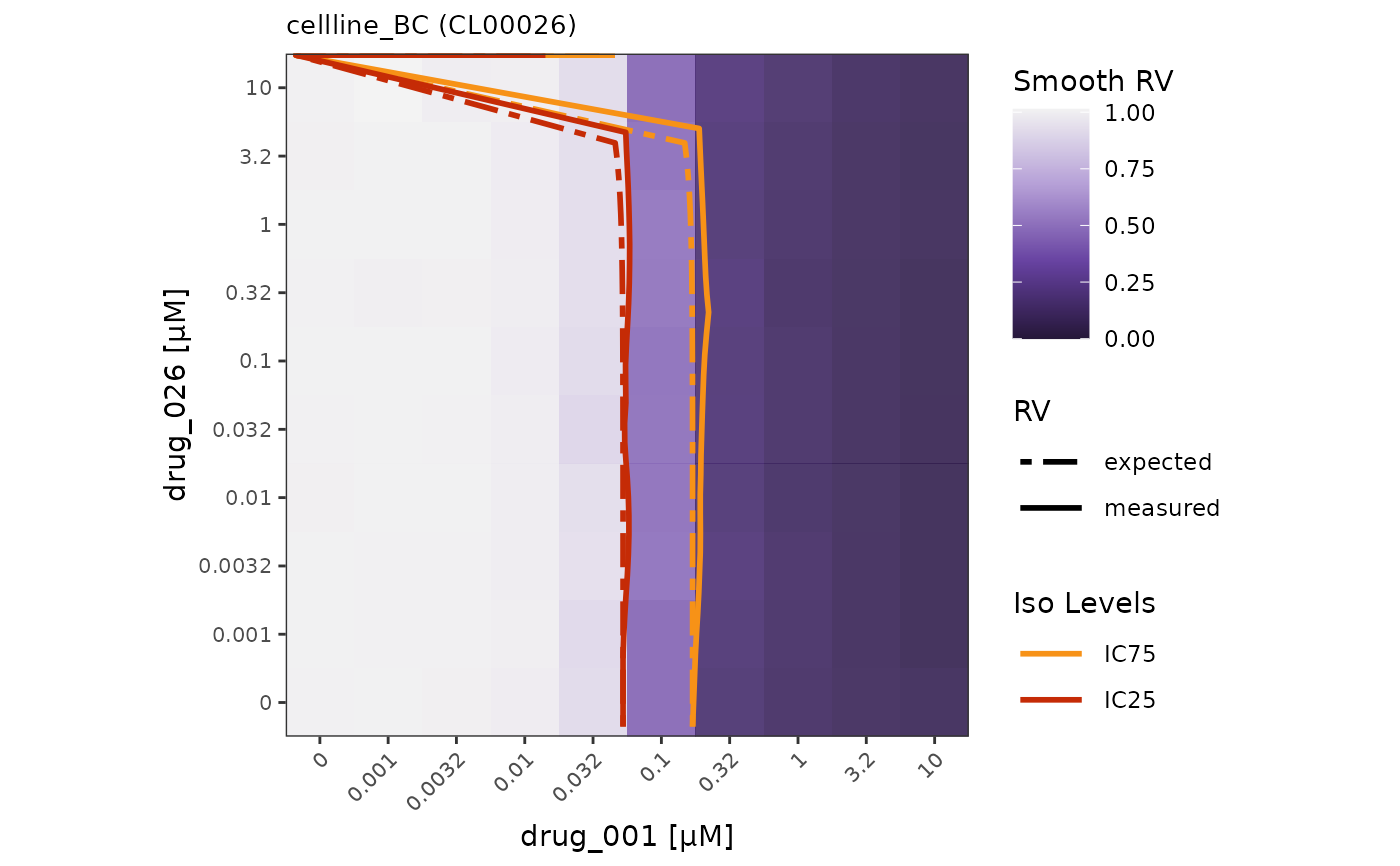
normalization_type = "RV",
iso_levels = c("0.25", "0.75"),
swap_axes = TRUE)
heatmap_combo_with_isoref(dt_excess,
dt_isobolograms,
drug1_name, drug2_name,
cl_name,
normalization_type = "RV",
iso_levels = c("0.25", "0.75"),
swap_axes = TRUE)
 heatmap_combo_with_isoref(dt_excess,
dt_isobolograms,
drug1_name, drug2_name,
cl_name,
metric = "hsa_excess",
iso_levels = c("0.25", "0.75"),
colors_vec_iso = c("0.25" = "darkcyan",
"0.75" = "darkblue"),
swap_axes = FALSE)
heatmap_combo_with_isoref(dt_excess,
dt_isobolograms,
drug1_name, drug2_name,
cl_name,
metric = "hsa_excess",
iso_levels = c("0.25", "0.75"),
colors_vec_iso = c("0.25" = "darkcyan",
"0.75" = "darkblue"),
swap_axes = FALSE)